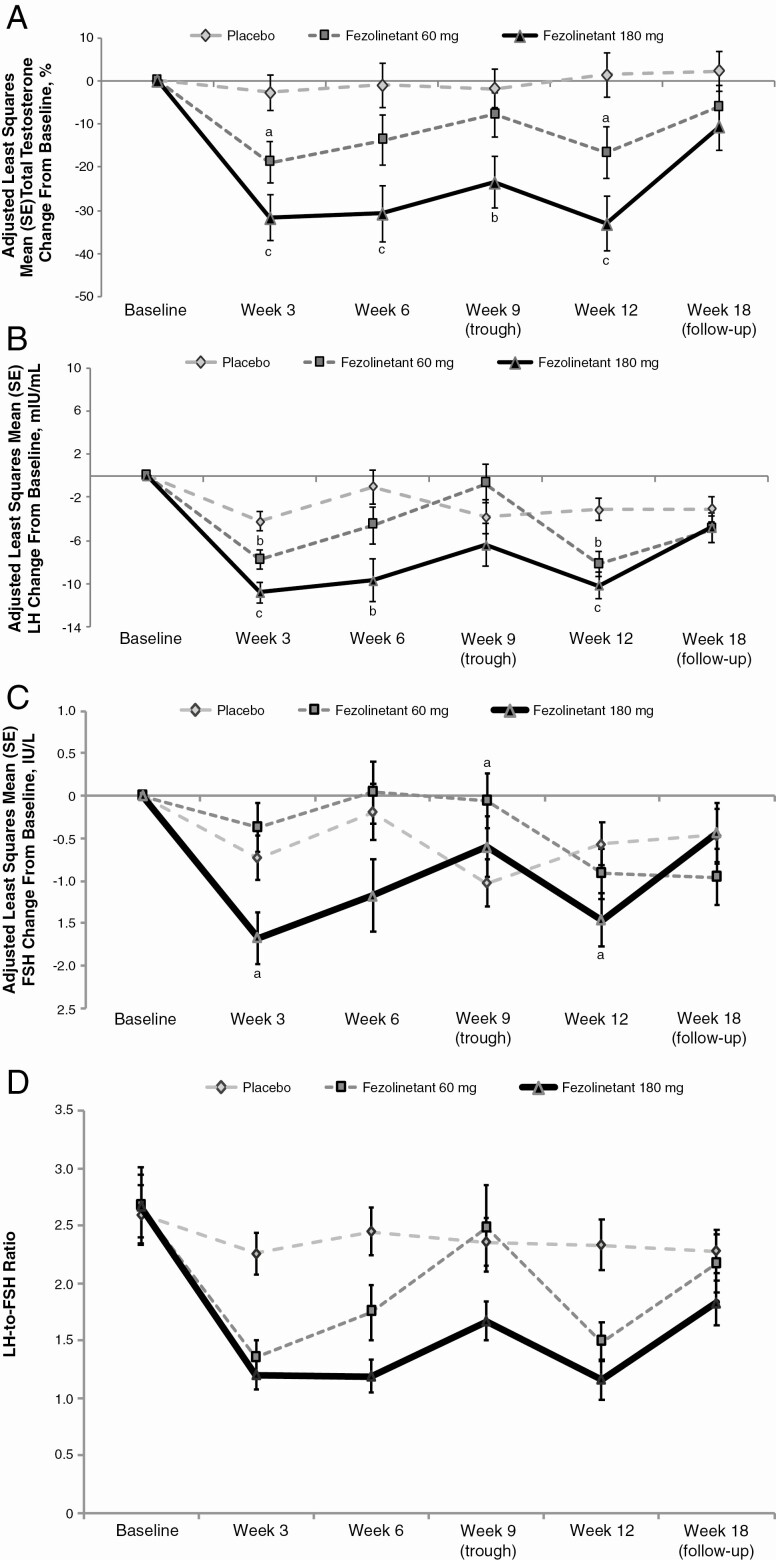
Figure 2.
A, Adjusted mean (SE) percentage change from baseline in total testosterone levels during treatment with fezolinetant vs placebo. B, Adjusted mean (SE) change from baseline in LH during treatment with fezolinetant vs placebo. C, Adjusted mean (SE) change from baseline in FSH during treatment with fezolinetant vs placebo. D, Effects of fezolinetant on LH-to-FSH ratio. All ITT population. Changes in these hormone levels were analyzed post hoc using an analysis of covariance model with treatment group as a fixed factor and baseline value as a covariate. aP < .05; bP < .01; cP < .001 vs placebo. Between-treatment statistical comparisons were not made on absolute LH-to-FSH ratios. Abbreviations: FSH, follicle-stimulating hormone; ITT, intent-to-treat; LH, luteinizing hormone.

