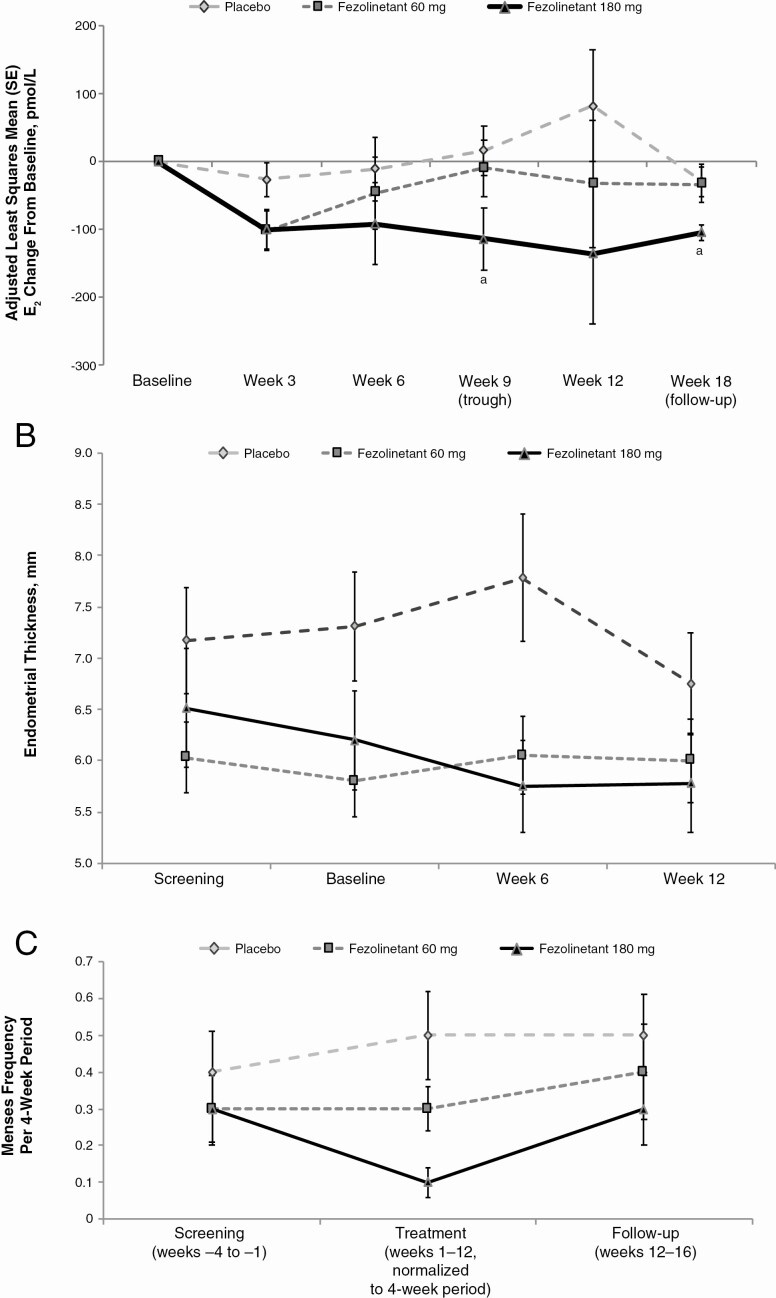
Figure 3.
Effects of fezolinetant on A, adjusted mean change in E2 based on ANCOVA; B, endometrial thickness over time; and C, menses frequency, ITT population. aP < .05; bP < .01. Change in E2 is based on least squares mean percentage change from the ANCOVA model with treatment group as a fixed factor and baseline value as a covariate. ANCOVA, analysis of covariance; E2, estradiol; ITT, intent-to-treat.

