Figure 6.

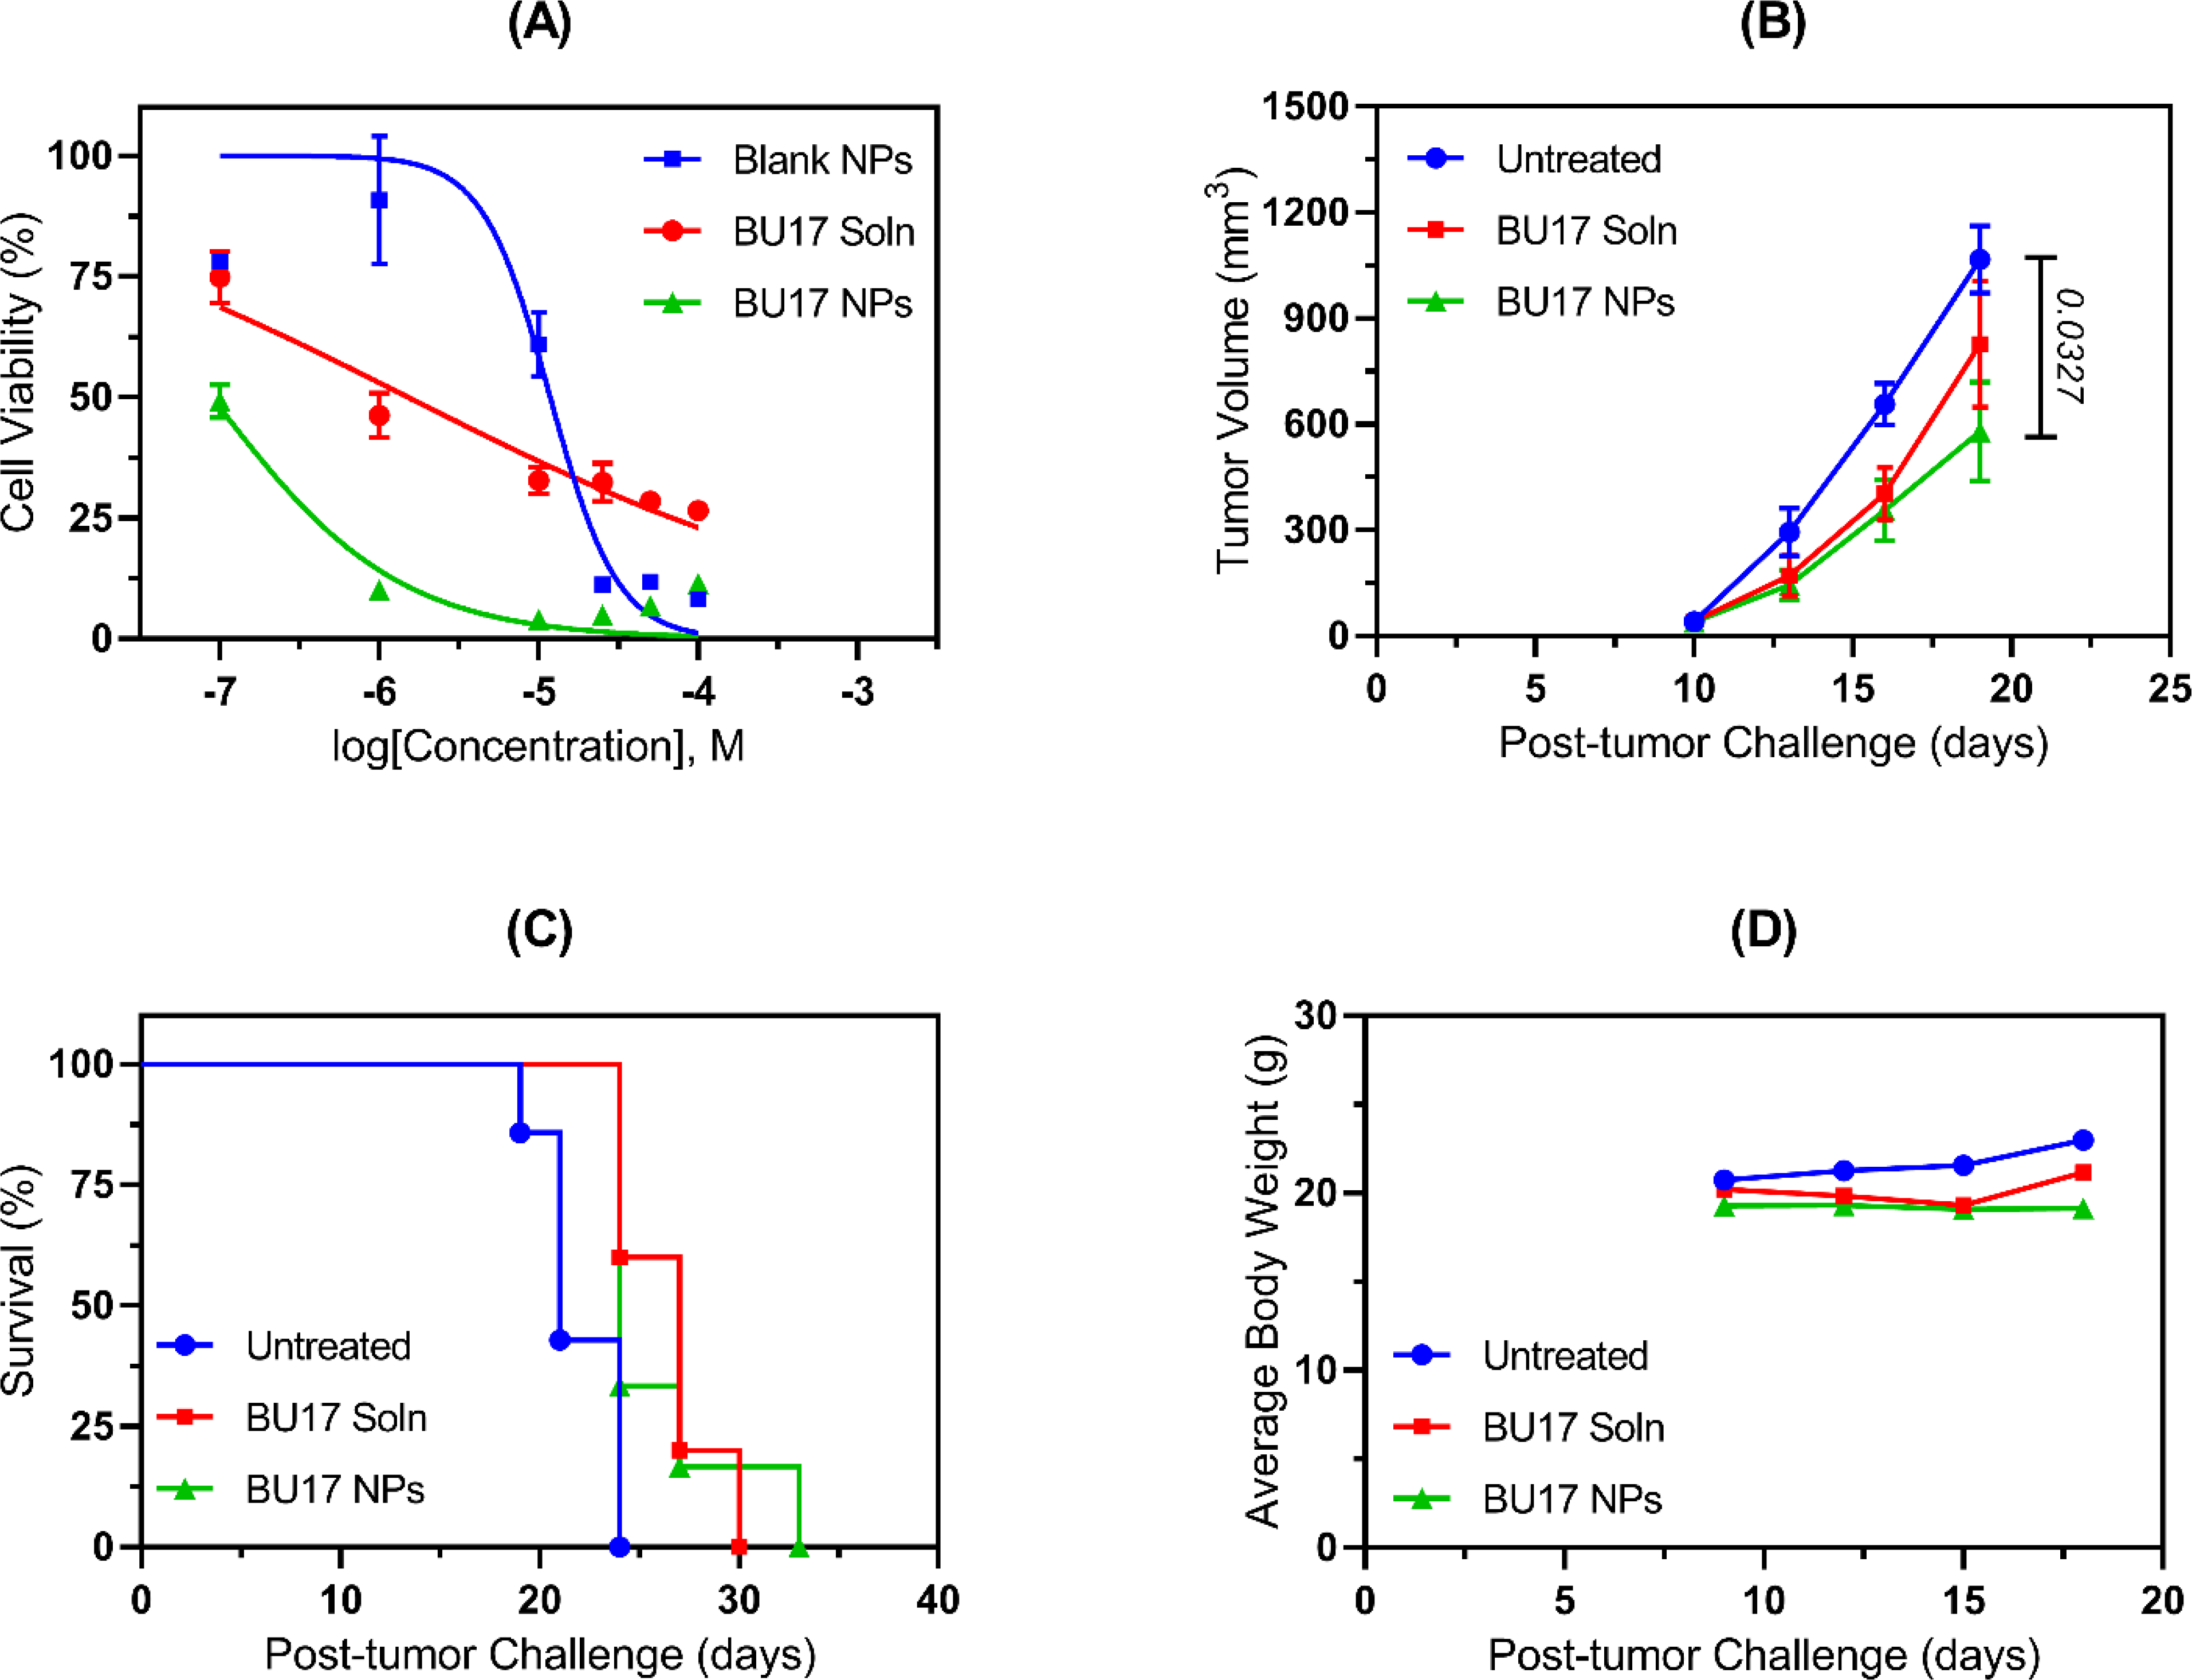
In vitro and in vivo antitumor efficacy of BU17 in solution (BU17 Soln) vs BU17-loaded nanoparticles (BU17 NPs). (A) Dose-response curves resulting from CT26 cells being incubated in vitro with either blank nanoparticles (IC50 11.84 μM), BU17 solution (IC50 1.52 μM), or BU17 nanoparticles (IC50 0.08 μM). (B) Tumor progression curve for mice inoculated with CT26 cells and administered with the designated treatment. (C) Mice survival curves where mice were euthanized when the tumor size exceeded 20 mm at the largest diameter or 10 mm in height. Survival analysis was initially performed by the Log-rank (Mantel-Cox) test using GraphPad Prism 8, and subsequent statistical analysis was carried out by pairwise comparisons where data were analyzed using Log-rank test (Tukey-Kramer adjusted) using SAS 9.4 software. (D) Mice body weight measurements over time.
