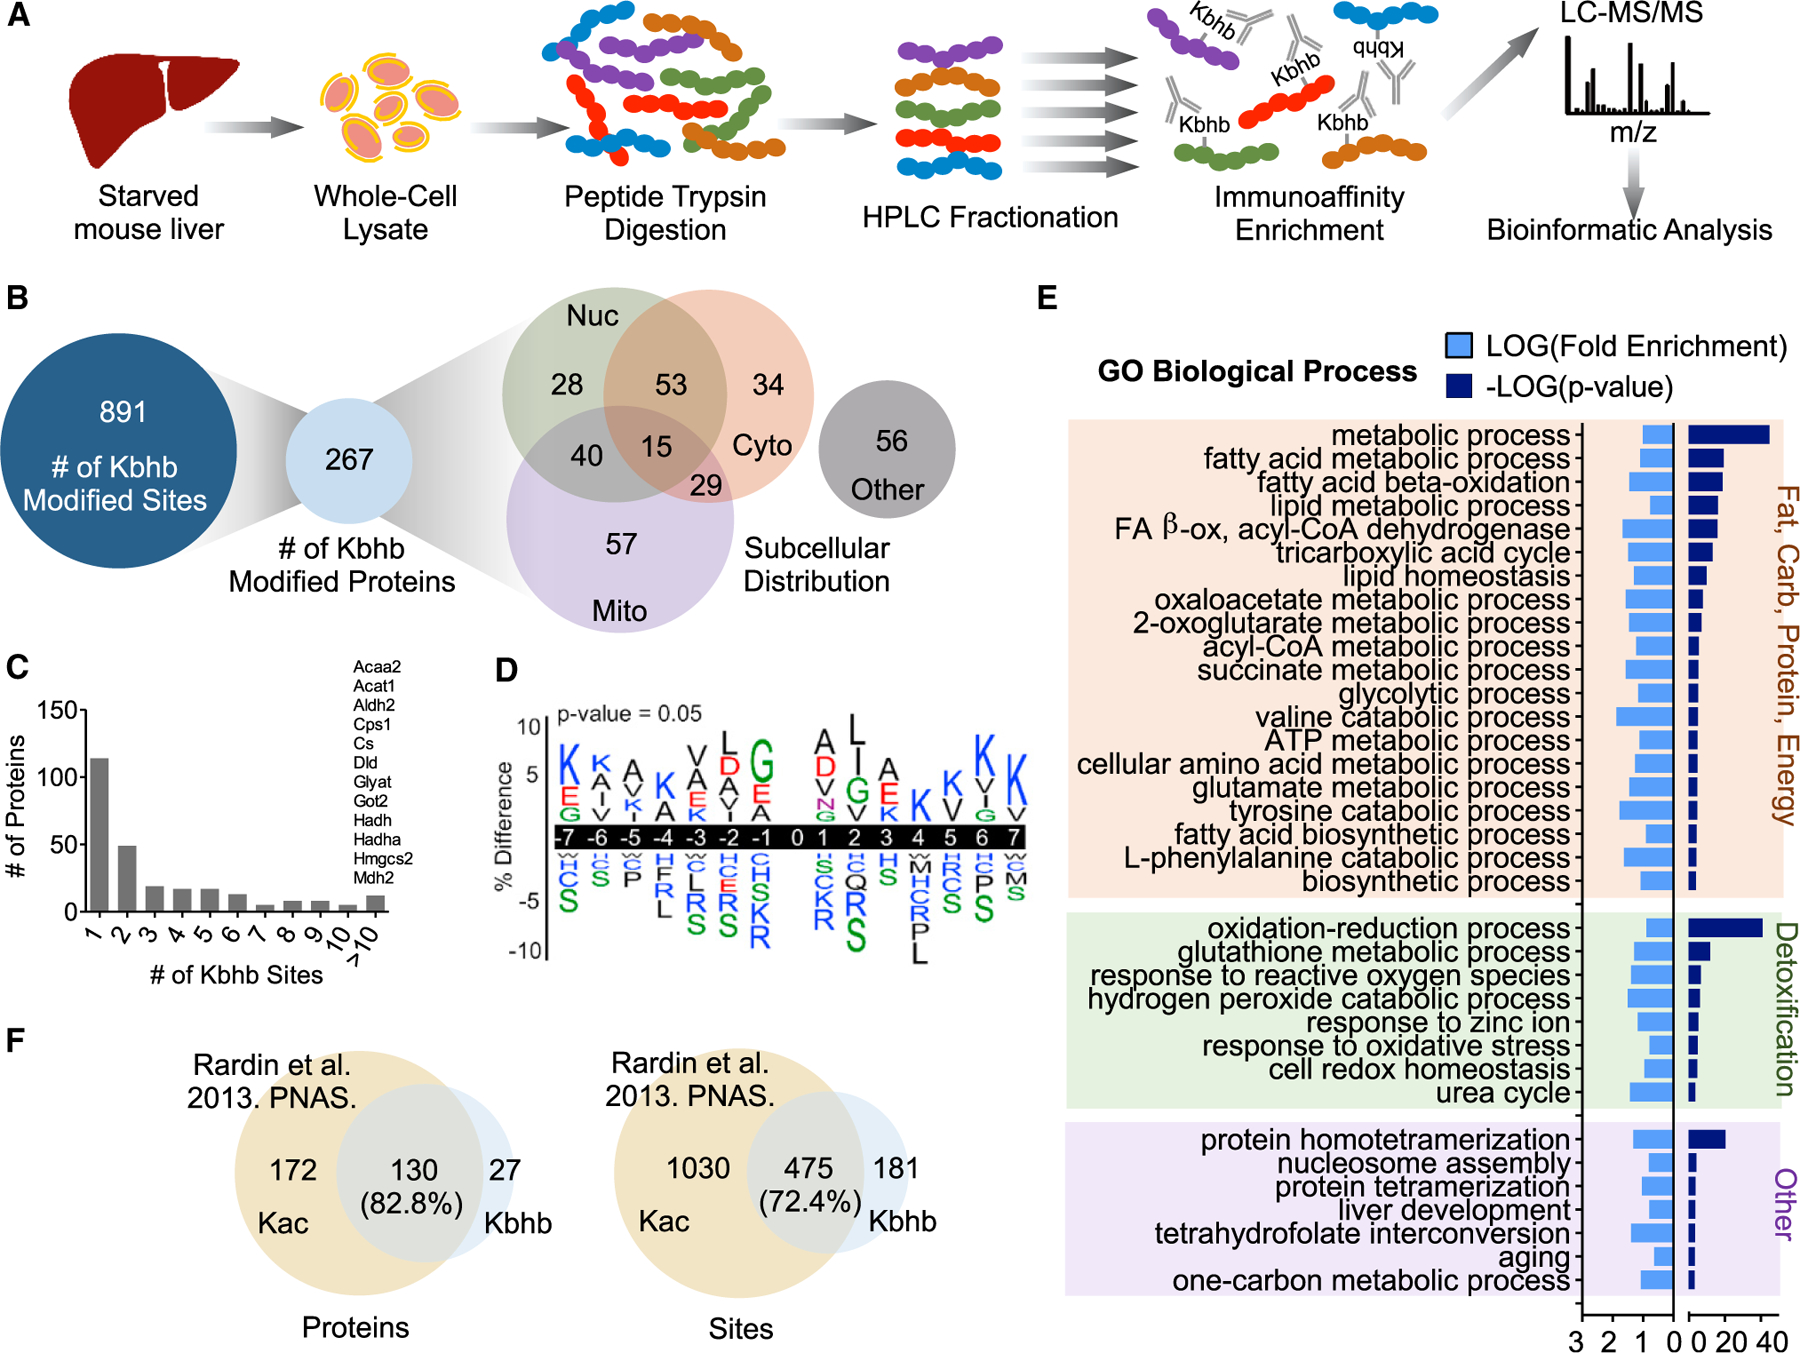
Figure 3. Characterizing the lysine β-hydroxybutyrylome in mouse liver.

(A) Schematic of β-hydroxybutyryllysine (Kbhb)-modified peptide identification. LC, liquid chromatography; MS, mass spectrometry.
(B) The number of Kbhb sites and proteins and their subcellular distribution as determined by the COMPARTMENTS database.
(C) Histogram of the number of Kbhb sites per protein. Proteins with more than 10 sites of Kbhb are listed above the corresponding bar.
(D) Sequence logo of Kbhb sites determined by iceLogo. Amino acids are colored by side-chain properties: blue, positively charged; red, negatively charged; green, polar uncharged; black, hydrophobic. 0, modification site.
(E) Results from DAVID Gene Ontology (GO) analysis. Significantly enriched pathways (p < 0.001) were categorized by cellular function for visualization.
(F) Overlap of Kbhb proteins and sites with Kac proteins and sites from Rardin et al. (2013b) (24-h starved mouse liver mitochondrial fractions). Only mitochondrial proteins (determined by MitoMiner) were compared.
See also Table S1.
