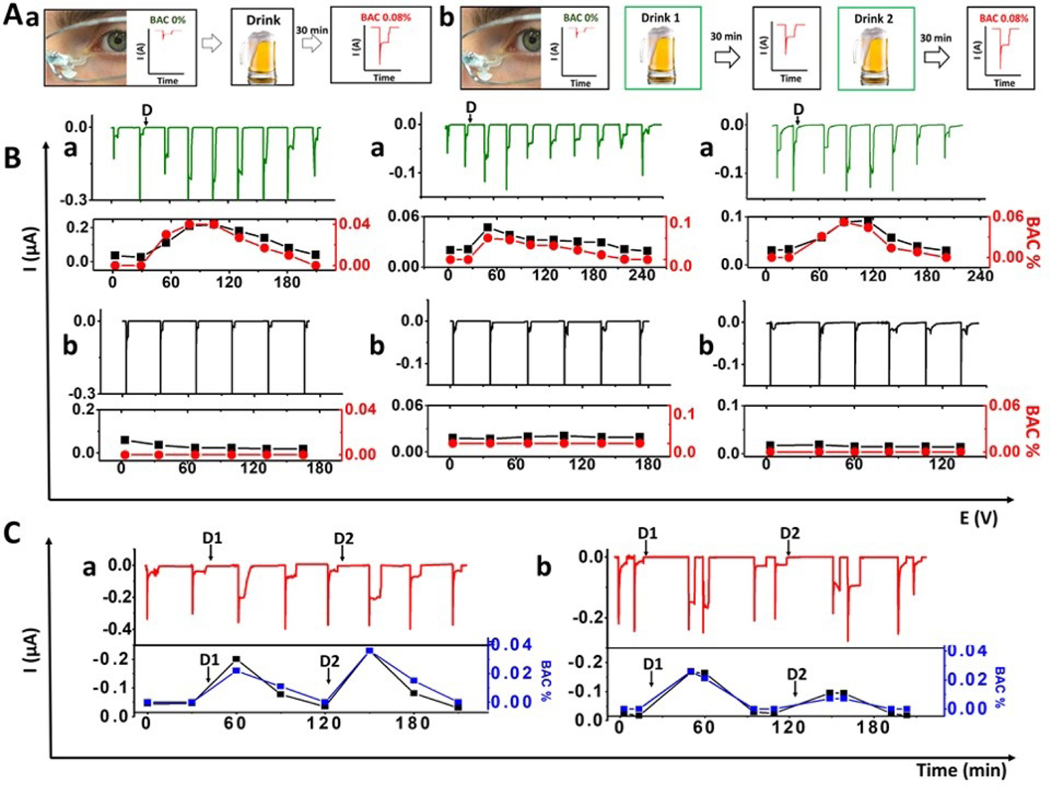
Figure 2. Real-time monitoring of alcohol intake in human subjects.
A) Timeline used for tears alcohol detection during on-body experiments in human subjects with alcohol consumption. First, tears were stimulated and measured before the alcohol consumption. Then, the subject consumed a drink and after 30 min the tears were stimulated again, and the corresponding chronoamperogram was recorded. For the first part the process (B(a)) was repeated until BAC 0.000% (a), and in the second part (C,a), a second drink was taken after BAC 0.000% and the cycle was repeated (b). B (a) Monitoring of tears alcohol concentrations prior to and upon the alcohol consumption until measured BAC reached 0.000 % for three subjects. Time of alcohol intake indicated by “D” in each plot. (b) Control experiment using the AOx-modified sensor, without alcohol consumption. In the bottom section black curves corresponds to amperometric current response and the red curve to BAC measured by breathalyzer. C) Chronoamperograms obtained for subjects a and b following consumption of two alcoholic drinks (D1 and D2). Below each amperogram is the BA- current/signal correlation for each volunteer, relating the observed tears alcohol current response (black) to the concurrent measured BAC (blue).

