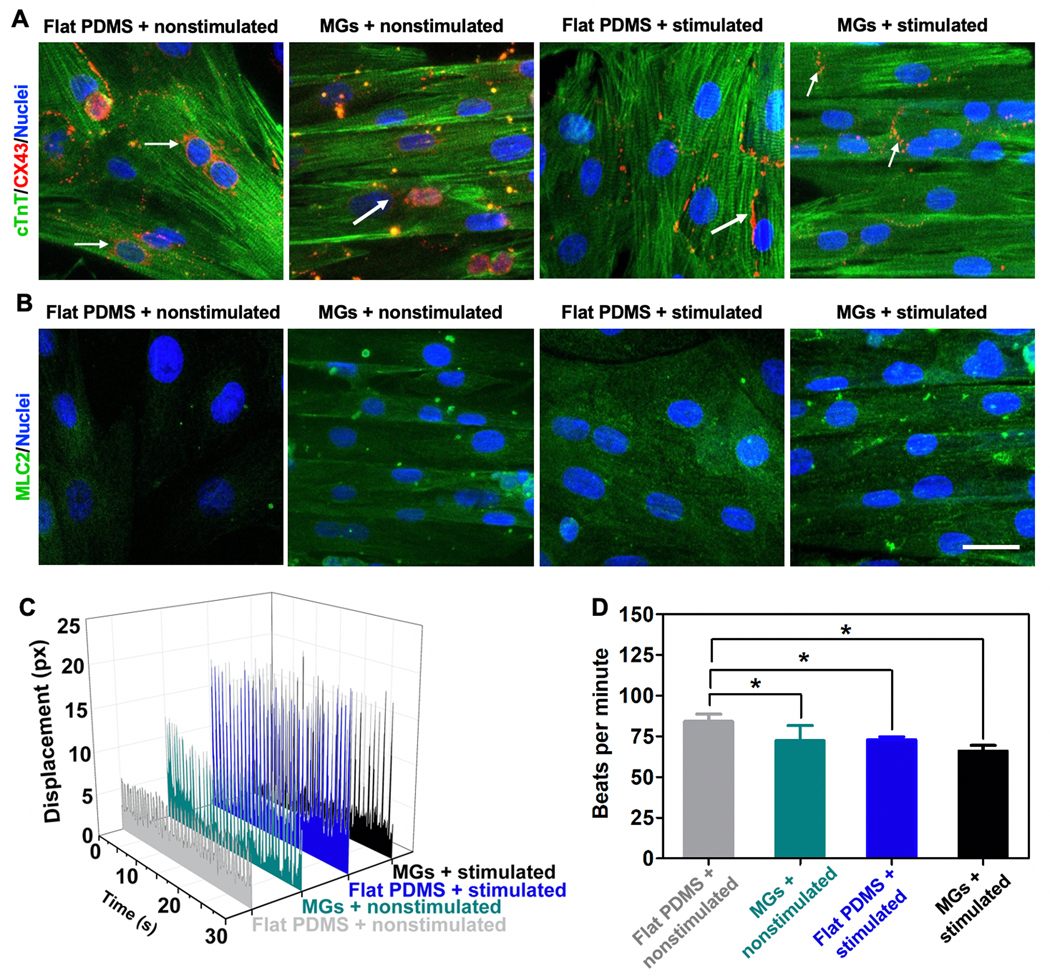
Figure 3.
Characterization of on-chip beating behaviors of CMs. A) cTnT and CX43 and B) MLC2 staining of CMs cultured under four different conditions (from left to right): flat PDMS + nonstimulated, MGs + nonstimulated, PDMS + nonstimulated, and MGs + stimulated conditions. (Scale bar = 25 μm, CMs were seeded on Day 1, stimulated on Day 3, and imaged on Day 4.) C) Beating behavior of CMs was monitored over 30 s and represented as displacement change of cell morphology under four different conditions. D) Quantification of beating behavior of CMs represented as beats per minute. (Data represent mean ± SD, n = 3; *p < 0.05, **p < 0.01, ***p < 0.001).

