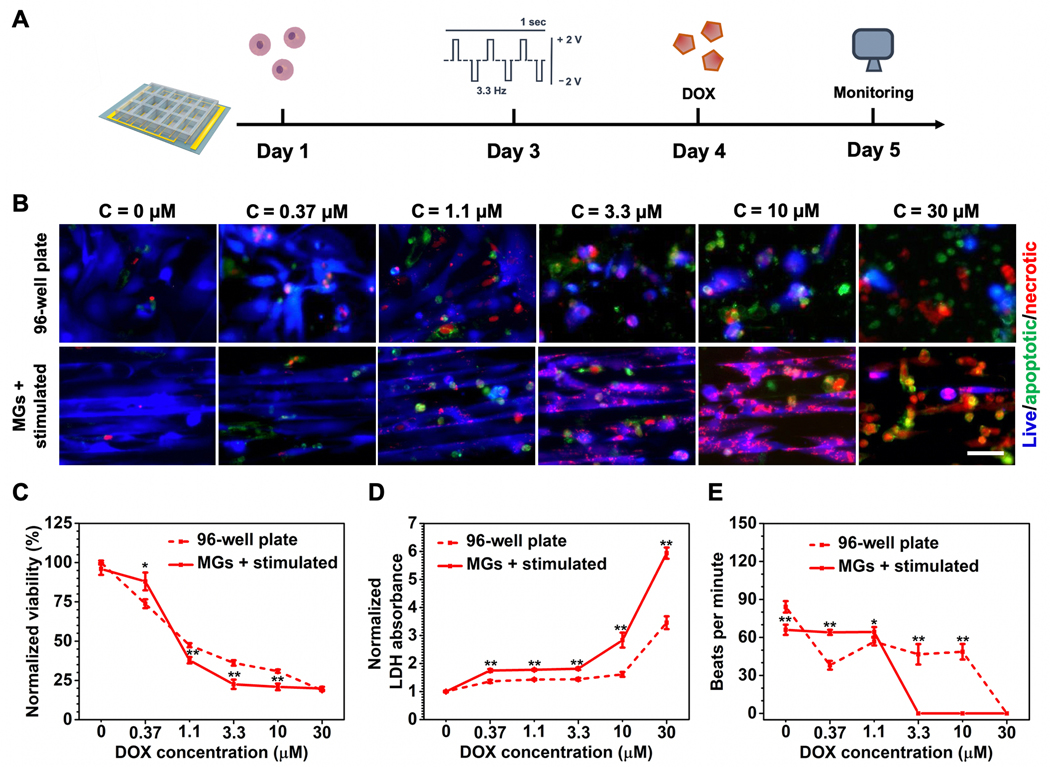
Figure 4.
Cardiotoxicity assessment induced by DOX. A) Schematic timeline of cardiotoxicity evaluations enabled by heart-on-a-chip. B) Representative fluorescent images of CMs viability treated by different dosages of DOX. (Scale bar = 50 μm, CMs were seeded on Day 1, stimulated on Day 3, followed by the addition of DOX on Day 4, and imaged on Day 5.) C) CCK-8 assay for quantitative analysis of CM viability treated by increasing doses of DOX. D) LDH assay for quantitative analysis of CMs viability treated by increasing dosage of DOX. E) Quantification of beating behavior of CMs treated by increasing dosages of DOX represented as beats per minute. (4C and 4D data are mean ± SEM, n ≥ 3; 4E data are mean ± SD, n = 3; *p < 0.05, **p < 0.01, ***p < 0.001).

