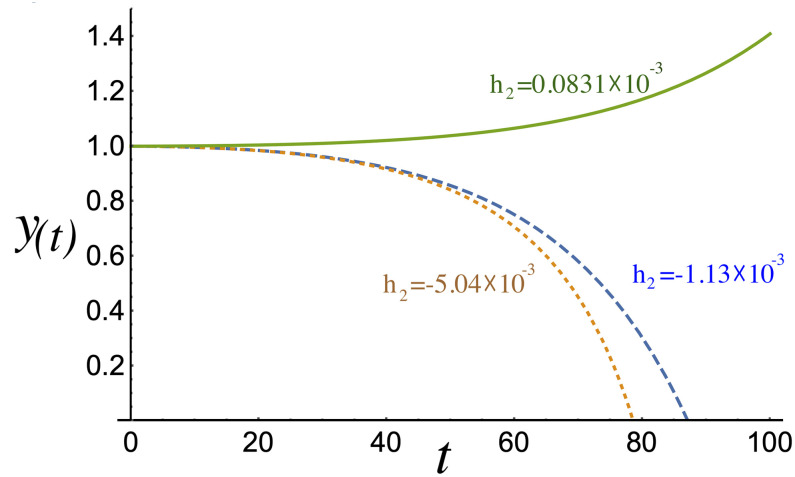
Fig 5. Comparison of the evolution of y(t) for different employee income concavities.
The mode of W(x, t) is y(t) and, if h2 < 0, over time it tends to zero. Conversely, if h2 > 0, y(t) diverges from zero. The dotted, dashed, and solid lines represent the evolution of y(t) corresponding to c1(x), c2(x), and c3(x), respectively, for h2 > 0.

