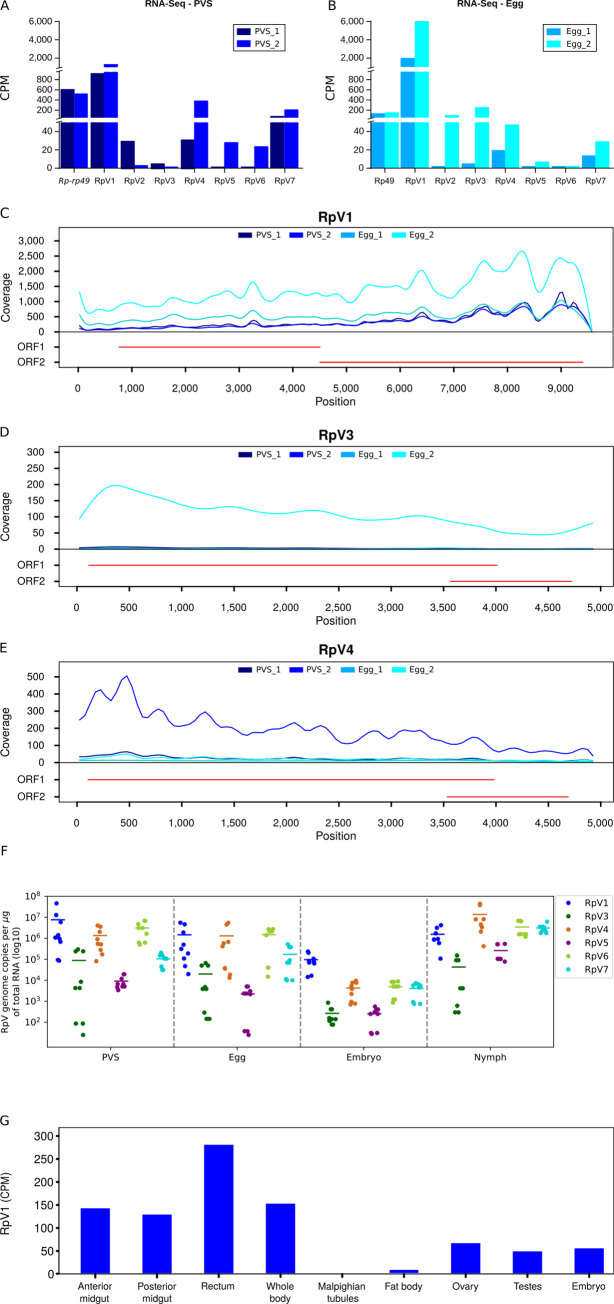
Fig 2. Stage-specific quantification of the RpVs during R. prolixus development.
(A) Normalized RNA-Seq reads for each virus in previtellogenic stages (PVS) of oogenesis. (B) Normalized RNA-Seq reads for each virus in unfertilized mature eggs (Egg) dissected from the abdomen of adult females. Biological replicates for both stages of oogenesis are scaled by counts per million (CPM). The endogenous Rp-rp49 gene is also displayed to underscore the abundance of the RpVs in ovarian tissues. Read coverage over the RpV1 (C), RpV3 (D) and RpV4 (E) viral genomes. Red lines indicate the organization of the genome for each virus. (F) Quantification of the RpVs in previtellogenic stages (PVS), mature eggs (Egg), embryos and 1st instar nymphs. RpV2 genome copies were below qRT-PCR detection limits and were not included in the box plot. Y-axis displays the number of viral genome copies per microgram of total RNA (Log10). (G) Quantification of RpV1 in different tissues of R. prolixus using available RNA-Seq datasets [46]. Y-axis displays the Counts per Million (CPM).

