

Abstract
Young children are aware of ethnicity-race, yet the field lacks measures to assess ethnic-racial identity (ERI) in early childhood. Thus, the goals of the current study were: (a) to describe three adapted measures that can be used to assess aspects of Mexican-heritage children’s ERI (i.e., attitudes, centrality, and knowledge), and (b) to test the psychometric properties of each measure among 182 five-year-old Mexican-heritage children. Results from confirmatory factor analyses supported a 2-factor solution characterizing positive and negative ERI attitudes; the subscales demonstrated adequate reliability and findings provided preliminary support for construct validity. Findings for ERI centrality revealed significant variability among children and initial support for convergent and divergent validity. Support for ERI knowledge was more limited and suggests further development of this measure is needed. Overall, the current study calls attention to the importance of assessing ERI in early childhood, and provides developmentally appropriate assessments to stimulate growth in this area.
Keywords: ethnic-racial/ethnic/racial identity, attitudes, centrality, knowledge, early childhood
Developing an awareness and understanding of one’s ethnic-racial background, including clarifying the psychological meaning that one personally attaches to this identity in relation to one’s self concept, is a normative developmental task for ethnic-racial minority youth (Phinney, 1992; Umaña-Taylor et al., 2014) and one that has been consistently linked with positive adjustment during middle childhood and beyond (e.g., Dulin-Keita et al., 2011; Rivas-Drake et al., 2014). The last three decades have seen an unprecedented increase in research devoted to understanding this normative task of ethnic-racial identity development, but the developmental period of early childhood remains largely ignored (Umaña-Taylor et al., 2014; Rogers et al., 2020; Williams et al., 2020). To increase our understanding of ERI development in early childhood, measures are needed. Although scholars have theorized about components involved in ERI development during early childhood (e.g., Bernal et al., 1990; Quintana, 1994; Williams et al., 2020), limited empirical work has tested ERI during this developmental period. This is an important gap to address because children as young as 4 years of age are aware of ethnicity-race and think about themselves and others with regard to ethnicity-race (Ausdale & Feagin, 2001; Bennett & Sani, 2003; Waxman, 2010). Further, individuals’ ERI development in early childhood is believed to inform their ERI in later developmental periods, which is consequential for adjustment (Williams et al., 2020; Umaña-Taylor et al., 2014).
In addition to the importance of focusing on young children, there is a critical need for work with Latinx children. In the past decade, Latinxs became the fastest growing ethnic-racial minority group in the U.S. – a growth that was particularly pronounced in younger age groups, with over 1 in 4 newborns in 2018 being Latinx (Krogstead, 2019). Currently, the field lacks reliable and valid measures that are developmentally and culturally appropriate to assess ERI development among young Latinx children. Thus, the aim of the present study was to advance the measurement of an important and salient construct in developmental science for a large and rapidly growing segment of the population by focusing on young Mexican-heritage children.
In the lifespan model of ERI, Williams and colleagues (2020) posit that there are 5 dimensions involved in ERI (i.e., ERI awareness, affiliation, attitudes, behaviors, and knowledge). The ERI dimensions manifest as specific components in each developmental period. Relevant to the current study, the ERI attitudes dimension refers to how individuals evaluate their ethnic-racial group(s) and their membership within their ethnic-racial group(s); and the ERI knowledge dimension refers to individuals’ working understanding of the behaviors, characteristics, values, and customs that are relevant to their ethnic-racial group (Williams et al., 2020). Scholars posit that during early childhood, examples of components that capture ERI attitudes are positive attitudes, negative attitudes, and centrality, which we assessed in the current study, in addition to ERI knowledge. Williams et al. (2020) note that a glaring gap in understanding children’s ERI is a lack of suitable measures with which to assess these important constructs. The goals of the current study were: (a) to describe three adapted measures to assess aspects of Mexican-heritage children’s ERI (i.e., attitudes, centrality, and knowledge), and (b) to test the psychometric properties of each measure.
ERI Attitudes
Tajfel and Turner (1986) posited that individuals categorize themselves and others to organize their social environments and provide a system of self-reference. As a part of this self-reference, which Tajfel and Turner (1986) identify as social identity, individuals develop attitudes and evaluations that are negative or positive. Although social identity theory was not focused on children or ethnicity-race specifically, prior findings suggest that children as young as five use ethnicity-race as a way to organize their social environments (Bennett & Sani, 2003).
Measurement of children’s attitudes dates back to the seminal doll studies conducted by Clark and Clark (1939, 1947), which were both critically important and controversial (Spencer, 2008). In the original doll test, African American children were presented with four dolls, two that had brown skin tones with brown hair and two that had white skin tones with blonde hair. Children were asked to select the doll that indicated their response to each question (i.e., who the child liked to play with, who was nice, who looked bad, and who was a nice color). Findings indicated that the majority of African American children demonstrated positive attitudes toward the white doll and negative attitudes toward the brown doll (Clark & Clark, 1939, 1947). The Clarks concluded that these findings indicated that African American children had low self-esteem and/or feelings of inferiority, which was tested and shown to be unsubstantiated by future studies (see Spencer, 2008 for a review). In an effort to improve our understanding of children’s attitudes, many subsequent studies implemented the doll test methodology (see Byrd, 2012 for a review).
Another measure that has been instrumental in assessing children’s attitudes is the Preschool Racial Attitudes Measure II (PRAM II; Williams, Best, and Boswell, 1975). In the original PRAM II, children were shown a series of pictures and related stories. Each story contained a drawn picture of a White person and an African American person, and either a positive adjective (e.g., good) or a negative adjective (e.g., naughty). Children’s selections indicated their positive and negative attitudes toward their own ethnic-racial in-group and toward another out-group. Scholars (e.g., Aboud, 2003; Bigler & Liben, 1993) have noted that tests such as the doll test and the PRAM II are problematic because they force children to choose between two groups, and children may feel that an attitude (e.g., good) applies to both their ethnic-racial in-group and a comparison out-group, or feel it applies to neither group.
Thus, Kowalski (2003) revised the PRAM II to address these concerns. In the revised version, children were shown a doll instead of a drawing, and only one doll at a time (first the doll that represented children’s in-group, and then a doll that represented an out-group). Using 14 cards that had either a negative or positive adjective, children were asked: “This card says smart. Some children are smart. Is this child smart or should smart go in the trash?” Children had the option to place the card in front of the doll if they felt it applied, or in the trash if they felt it did not apply. Kowalski (2003) tested children’s attitudes using the revised independent choice version of the PRAM II and the original, forced-choice PRAM II. Kowalski (2003) demonstrated that children tended to be more positive toward both their in-group and the out-group when these dimensions were assessed independently.
Stokes-Guinan (2011) pointed out that although an independent measure was important, the scoring method used by Kowalski (2003) was problematic. In particular, Kowalski’s (2003) scoring involved creating a composite positive attitudes score by summing the number of positive adjectives assigned to the doll (i.e., positive attitude was endorsed) with the number of negative adjectives that were assigned to the garbage can (i.e., negative attitude was not endorsed). Prior work has indicated that endorsing a positive statement is not the same as not endorsing a negative statement (e.g., Aboud, 2003). Thus, Stokes-Guinan (2011) further revised the PRAM II by changing the scoring so that a sum score was calculated for positive attitudes, and a separate sum score was calculated for children’s negative attitudes.
Although both Kowalski’s (2003) and Stokes-Guinan’s (2011) changes to the methodology and scoring of the PRAM II have propelled forward the measurement of children’s attitudes, there are still limitations that the present study addressed. First, we accounted for variability in physical appearance. For example, a Mexican child may have a light skin tone and blonde hair or may have a dark skin tone and black hair. Thus, instead of presenting a doll to a child and labeling it as “Mexican,” we showed children five different dolls that ranged in skin tone and hair color, and asked children to hand us the Mexican doll (see Figure 1). The doll that children selected was then used as a visual representation of a Mexican child to assess Mexican children’s attitudes toward their own ethnic-racial group.
Figure 1.
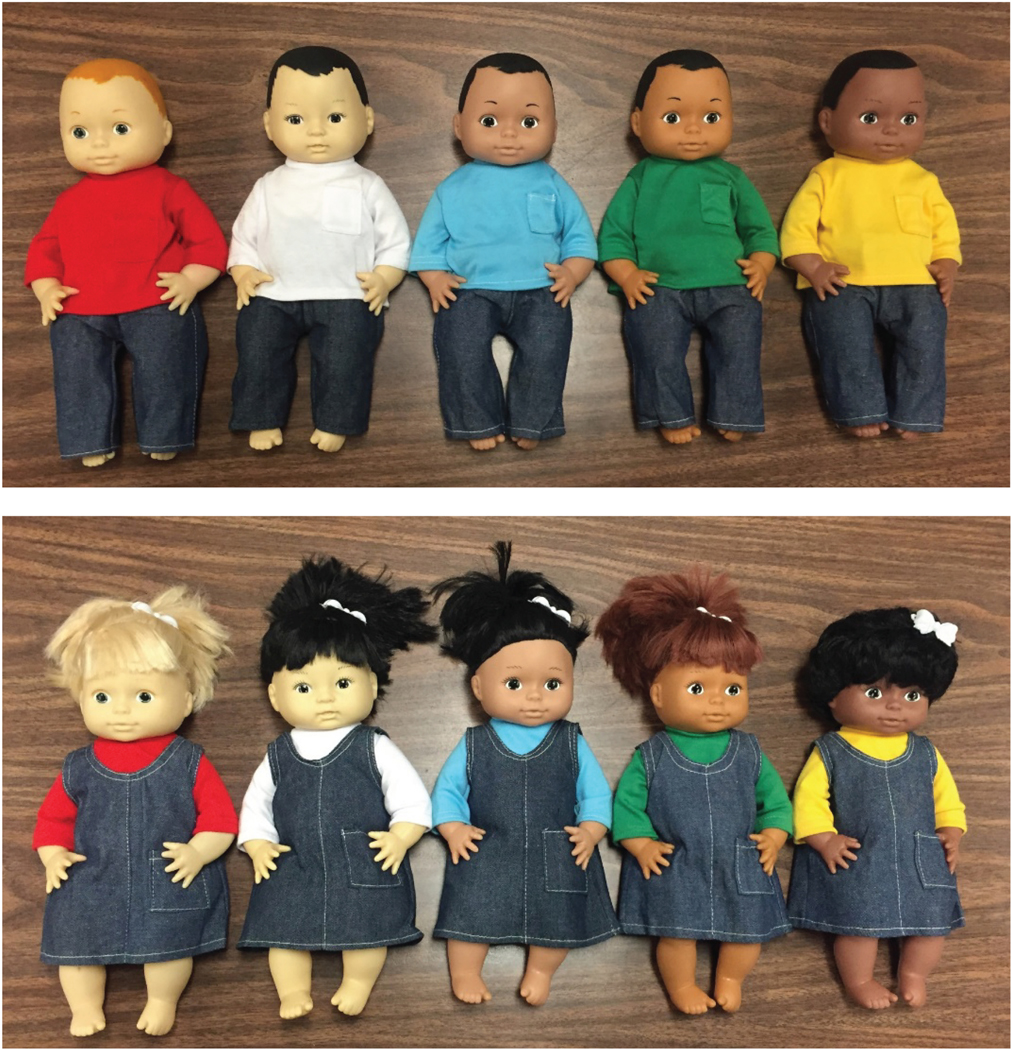
The five boy dolls that were shown to boys and the five girl dolls that were shown to girls in the ethnic-racial identity attitudes measure.
Second, although Stokes-Guinan’s (2011) work translated the original items in the PRAM II into Spanish, items were not tested to be equivalent in both languages. Thus, we reviewed the 14 items used in Kowalski’s (2003) revised version of the PRAM II (Williams et al., 1975) in English (i.e., smart, good, mean, ugly, pretty, clean, unfriendly, bad, friendly, nice, stupid, naughty, helpful, dirty) and through a process of decentering (described in detail in the measures section of the Method) we arrived at a revised set of English and Spanish items that were meaningfully equivalent (Knight et al., 2009).
ERI Centrality
Individuals consider many different aspects of their identity as being important to how they think of, or define, themselves. ERI centrality, specifically, captures the extent to which ethnicity-race is an important part of individuals’ overall self-concept (Scottham et al., 2008). Although scholars suggest that centrality begins to form during childhood (e.g., Umaña-Taylor et al., 2014; Williams et al., 2020), a majority of existing work on centrality has focused on the developmental period of adolescence (e.g., Okeke et al., 2009; Rivas-Drake, 2011). A focus on how central ethnicity-race is to children’s self-concept is important given that sex and race are particularly relevant categories that shape development during the period of childhood (Katz & Kofkin, 1997). Critical to studying centrality during this developmental period are valid and reliable measures for young children.
Earlier work on this topic assessed kindergarten children’s centrality by asking them to describe who they were using an open-ended question, and coding whether social categories (e.g., ethnicity-race) were mentioned in children’s responses (Aboud & Skerry, 1983). Findings indicated that few of the children spontaneously mentioned any social categories to describe themselves; instead they tended to describe themselves in terms of external characteristics (e.g., appearance, possessions, behavior; Aboud & Skerry, 1983). Later, Turner and Brown (2007) created an identity ranking task to assess children’s centrality. In this task, 5- to 12-year-old children were given six popsicle sticks that had their name printed on each stick (referred to as “self sticks”), and were shown six boxes with pictures that represented a category with which children could identify. The categories included the following: child’s sex, ethnicity-race, age, children who like video games and/or computers, children who like pets/animals, and children who like sports. Children were instructed to place the “self-stick” in the box that showed the category that was most important to them. The task was repeated until all sticks had been placed in the boxes, and children were given a score based on when the self-stick was placed in the ethnicity-race box. Findings indicated that ethnicity-race was least central to children’s self-concept in comparison to the other categories that were chosen first (Turner & Brown, 2007).
Although Turner and Brown’s (2007) introduction of the identity ranking task was important because it provided a tool for assessing young children’s centrality, the present study aimed to further revise the measure. First, given that some of the categories in the measure were social (e.g., sex), and others were preferences (e.g., like pets/animals), there may have been a confounding effect of category type. Turner and Brown (2007) found that children were more likely to select preferences instead of social categories to describe themselves; however, different findings may emerge if children could only choose from social categories. Thus, the present study adapted the identity ranking task so that it only included social categories (i.e., daughter/son, five-year-old, friend, Mexican, and girl/boy), which were presented using a boy or girl model (see Figure 2). This is important because it provides a tool that can be used in future research to test the centrality of ethnicity-race when children only have social categories from which to choose. Second, we adapted the measure to be developmentally appropriate for a sample that consisted of children who were five years of age by using a puppet to describe the task to children so that there was a visual reminder of why they were describing themselves. This process of using a puppet is more developmentally appropriate because it can help increase children’s understanding of research-related activities and better engage them and sustain their attention (Epstein et al., 2008).
Figure 2.

The five social category options from which children could select in the ethnic-racial identity centrality measure, which included (a) Son/Daughter, (b) Five-Year-Old, (c) Friend, (d) Boy/Girl, and (e) Mexican.
Note. Boys were shown the top row that featured boys in these roles, and girls were shown the bottom row that featured girls in these roles. For the Mexican category, there were five different cards for each gender that featured one of the five dolls that children were shown in the beginning of the tasks. Children were only shown the card for the Mexican category that featured the doll that matched the Mexican doll that they selected as Mexican at the beginning of the task.
ERI Knowledge
The knowledge that individuals develop about their social group membership plays an important role in development. Bernal and colleagues (1990) theorized that knowledge, specifically individuals’ understanding that certain values, behaviors, and customs are a part of their ethnic-racial group, is an important aspect of children’s ERI. This aspect of ERI was initially measured by asking preschool-aged Mexican children about behaviors that Mexican children may do (Bernal et al., 1990). After the first study, researchers revised the task, and in the second study, children were told that there were two towns, one Mexican town and one Anglo town. Children were asked about the likelihood or frequency of 10 events occurring in each town, such as “How many of the people in the Mexican town eat menudo?” Children responded by pointing to a “none” circle that was small with no faces on it, a “some” circle that was medium and filled hallway with faces, or an “all” circle that was large and entirely filled with faces (Knight et al., 1993).
Bernal and colleagues’ (1990) knowledge measure and Knight et al.’s (1993) revisions to the measure were instrumental because these studies were the first to assess this construct. The current study built on these prior instruments. In particular, given that Mexican children who were born, raised, and/or living in the U.S. are also involved in mainstream U.S. American culture, it is possible that children’s knowledge of what it means to be Mexican may include aspects that are traditionally Mexican and traditionally U.S. American. Indeed, in a related body of work on immigrant youths’ cultural orientation, scholars emphasize that the processes of acculturation (i.e., individuals adapting the values, beliefs, behaviors of the mainstream culture; Berry, 2003) and enculturation (i.e., individuals maintaining the values, beliefs, and behaviors of the heritage culture; Berry, 2003) are independent processes that can occur simultaneously (Gonzalez et al., 2009; Padilla, 2006).
Thus, in the present study we expanded on Bernal and colleagues’ (1990) work by including a third category (i.e., a “both” option) to capture this possibility. In addition, given that our task included three categories, rather than the two categories used in earlier work (i.e., Bernal et al., 1990; Knight et al., 1993), we provided a more concrete assessment tool for young children by providing children with visual options (i.e., cards) from which they could choose their response to each question (see Figure 3). One card depicted something traditionally Mexican (e.g., kissing on the cheek), another card depicted something traditionally American (e.g., shaking hands), and the last card depicted both (i.e., kissing on the cheek and shaking hands). Children were asked to select the card that represented what they thought about Mexican children (e.g., “What do you think Mexican children do when they say ‘Hi’ to someone?”). The process by which the traditionally Mexican and traditionally American depictions were chosen will be further explained in the measures section of the Method.
Figure 3.

Response options for one of the questions in the ethnic-racial knowledge measure. Children were asked: “What do you think Mexican children do when they say ‘Hi’ to someone?” Children selected one of the three response cards: “kiss on the cheek,” “shake hands,” or “kiss on the cheek and shake hands.”
The Current Study
The goal of the current study was to advance the measurement of young Mexican-heritage children’s ERI by introducing three adapted ERI measures: the ERI attitudes measure, the ERI centrality measure, and the ERI knowledge measure. We tested the psychometric properties of the measures. Specifically, we examined descriptive statistics (e.g., frequencies, distributions), and convergent and divergent validity (i.e., whether the ERI measures were correlated with other measures in theoretically expected ways).
Regarding convergent validity, based on theory (i.e., the social cognitive model of the development of ethnic identity and ethnically based behavioral styles; Knight et al., 1993) and previous work (e.g., Bernal et al., 1990; Rivas-Drake et al., 2009), we expected aspects of ERI to be associated with mothers’ nativity and children’s self-labeling. Divergent validity is supported when the measure is unrelated to constructs with which there is not a conceptual reason to expect a significant association. To examine divergent validity, we used a measure of children’s effortful control (i.e., temperament), given that there is no conceptual reason for why this construct should be significantly associated with children’s ERI. Finally, for the multi-item measures (i.e., attitudes and knowledge), we examined the factor structure and reliability.
Method
Participants and Procedure
The present sample included 182 Mexican-heritage children from a larger longitudinal study of Mexican-heritage young mothers, their mother figures, and their children (Umaña-Taylor et al., 2015). Twenty-two children were excluded from the study because their fathers were not Mexican-heritage. In the larger study, pregnant adolescents were recruited from community agencies and high schools in a Southwestern metropolitan area. Initial eligibility criteria included that adolescents had to be of Mexican origin, 15 to 18 years old, currently pregnant, not legally married, and have a mother figure (e.g., biological mother, grandmother) who was willing to participate. Participants were interviewed annually for six years in their homes, and beginning when adolescent mothers were in their third trimester of pregnancy (Wave 1; W1), and annually thereafter when children were: 10 months (W2), 2 years (W3), 3 years (W4), 4 years (W5), and 5 years of age (W6).
The current study utilized data from W6 (conducted in 2012–2013) because that is when young children’s ERI was assessed. Mothers received $60 for their participation at W6, and an additional $25 for their child’s participation. All procedures were approved by the university’s Human Subjects Review Board. The majority of mothers were U.S.-born (63%) and among mothers born in the U.S., most (69%) were 1st generation (i.e., they had a mother and/or father who was born outside the U.S.). Mothers averaged 21.95 years of age (SD = 1.00) at W6. Regarding mothers’ education at W6, 10.3% were currently attending school, 38.7% dropped out of high school and did not get a GED (General Educational Diploma), 39.4% graduated from high school and were not currently pursuing more education, and 11.6% earned a GED and were not currently pursuing more education. The majority of children were male (59%) and completed their assessments in English (68%). The average family income at W6 was $26,220 (SD = $18,044), which was calculated by creating a sum of grandmothers’ income, additional funds contributed to the household by others, and public financial assistance (i.e., public assistance, food stamps).
Measures
For translating items into Spanish for all measures, we followed recommendations outlined by Knight et al. (2009), which involve translating, back-translating, and following a process of decentering to arrive at the final English and Spanish items. In the process of decentering, both the original language English version of the measure and the Spanish version were modified until both versions were semantically equivalent and relevant in both languages. For the translation process, the research team consisted of native Spanish speakers, some of whom were Mexican-heritage, and the final translations were reviewed by additional Mexican-heritage individuals who were not involved in the translation process to ensure cultural validity.
Children’s ERI.
To orient children to the term Mexican, we showed them a brief 2-minute puppet show video that we designed. The video featured two puppets, María and Tomás. In both the English and Spanish versions of the video, the names of the puppets were pronounced in Spanish. The voice actors were both Latina females, one was of Mexican heritage, and both were native Spanish speakers (see below for the video description in English and see the Appendix for the script of the video in Spanish). The video begins with Tomás asking María if she knows what the word Mexican means. María responds by saying that “Mexican means a person who has a family from Mexico.” Tomás asks María if she is Mexican, and María responds by saying “Yes, I am Mexican. A long time ago, my grandma came from Mexico to here, where I live. Some of my family still lives in Mexico, and we go visit them sometimes. It is far away so we have to drive a car for a long time or we have to take an airplane to go see them. All of my family and me are called Mexican because my grandma came from Mexico. Other people can be Mexican because they were born in Mexico and then they moved.” Tomás then says, “Oh okay María. But I have another question. None of my family lives in Mexico, they all live in Arizona, but a long, long, LONG time ago, my grandma’s grandma came from Mexico. Am I still Mexican?” Maria responds by saying, “Yes Tomás, you are still Mexican.” Tomás then ends by saying “Oh okay, now I know what Mexican means. Mexican means a person who has family from Mexico, and so I am Mexican. Thanks María, I have to go because my mom is making dinner.” After the video ended, children were shown five dolls, ranging from lighter to darker skin tones. To avoid the potential confounding effect of sex (Kowalski, 2003), girls were shown five female dolls, and boys were shown five male dolls. Children were asked, “Now I would like you to look at these girls/boys, and please give me the girl/boy doll that you think is the Mexican girl/boy.” The doll that was selected by the child was then used for the following tasks to provide a visual reminder of what the child identified as Mexican, and to provide a concrete object to help keep the concept salient.
Children’s ERI attitudes.
To assess ERI attitudes, we adapted the PRAM II Measure originally created by Williams and colleagues (1975), and further refined by Kowalski (2003) and Stokes-Guinon (2011). As we reviewed the original 14 items (i.e., smart, good, mean, ugly, pretty, clean, unfriendly, bad, friendly, nice, stupid, naughty, helpful, dirty), nice was changed to kind and stupid was changed to dumb so that the items had the same meaning in both languages. Further, we were unable to find a meaningful equivalent in Spanish that was developmentally appropriate for the words unfriendly and helpful; thus, these were removed from the measure. Finally, although pretty and the Spanish equivalent word were retained for use with girls, handsome and the Spanish equivalent word were used with boys (instead of pretty). Thus, the final 12 items for the measure included: smart, good, ugly, pretty/handsome, clean, bad, friendly, kind, dumb, naughty, dirty, and mean in English and inteligente, bueno/a, feo/a, bonita/guapo, limpio/a, malo/a, amigable, amable, tonto/a, travieso/a, sucio/a, and grosero/a in Spanish. Final translations were reviewed by Mexican-heritage individuals to ensure cultural validity (Knight et al., 2009).
Given that many adjectives in Spanish are sex-specific (i.e., in English, good can be used to describe boys and girls, but in Spanish bueno is used to describe boys, and buena is used to describe girls), we created a separate set of cards for boys and girls. The English version of each word was printed on one side and the Spanish version of each word was printed on the other side. Before the task began, children were instructed, “I am going to show you a card, and if the word on the card describes the Mexican girl/boy, then you put it in front of the Mexican girl/boy. If the word on the card does not describe the Mexican girl/boy, then you put the card in front of the garbage can.” Then, children were shown a card with one word printed on it, and told the following: “This card says _____. Some children are _____. Is the Mexican girl/boy _____?” This was repeated for all 12 cards.
We scored the measure by creating two subscales: a 6-item positive attitudes subscale, and a 6-item negative attitudes subscale. For positive attitudes, children received a score of 1 when they assigned a positive adjective to the Mexican doll. For negative attitudes, children received a score of 1 when they assigned a negative adjective to the Mexican doll. Scores were summed for each subscale, and ranged from 1–6. Higher scores indicated more positive and negative attitudes, respectively.
Children’s ERI centrality.
To assess children’s ethnic centrality, we adapted Turner and Brown’s (2007) task to make it developmentally appropriate for 5-year-old children. To adapt the measure, we first examined the original five categories that were used, and changed the preference categories to two relevant social categories: friend and son/daughter. Thus, in the current study, the five options were son/daughter, five-year-old, friend, boy/girl, and Mexican. Then, materials for the task were developed by creating and laminating photos of each of the five categories using either a boy model or a girl model. For example, for the “son” card, a young 5-year old Latinx boy was photographed holding the hand of a Latinx adult female posed as his mother.
Second, we adapted the measure to be developmentally appropriate for a sample that consisted of younger children who were all five years of age. To do so, a puppet was used to describe the task to children so that there was a visual reminder of why they were describing themselves. In particular, children were shown a puppet (girls were shown María and boys were shown Tomás) and told: “This is María/Tomás. María/Tomás has this blindfold over her/his eyes and cannot see you, but we are going to teach her/him about you.” Children were then shown five boxes, each with a card in it that had a picture of a social category applicable to them that they could use to describe themselves: son/daughter, five-year-old, friend, boy/girl, and Mexican. Children were given a marble and instructed to put it in the box that represented the most important thing they wanted María/Tomás to know about them (e.g., that they were a 5-year-old). After the child placed the marble in a box, the box was removed and the child was instructed to put the marble in the box that represented the next most important thing he/she wanted María/Tomás to know about him/her. This was repeated until all boxes were removed. The task was scored based on when the child put the marble in the Mexican box (i.e., 1st, 2nd, 3rd, 4th, 5th choice). This assigned value is reverse-coded so that higher scores indicate higher ERI centrality (i.e., if the Mexican box was chosen first, the child receives a score of 5).
Children’s ERI knowledge.
To assess children’s knowledge of Mexican culture, we built on the construct originally conceptualized by Bernal and colleagues (1990). In our revised task, children were asked eight questions about Mexican culture that focused on holidays, food, and other customs. To create the items, we consulted with members of our ethno-racially diverse team of faculty, graduate students, and postdoctoral scholars to brainstorm developmentally appropriate Mexican customs that children would understand. As we refined and finalized items, we consulted with Mexican-heritage community members who had young children. After items were finalized, cards were created for each item using cartoon animations (e.g., sports) or an actual photograph that we took for the purpose of the study (e.g., food). The final eight items included: what Mexican children do at their birthday parties (break a piñata, pin the tail on the donkey, or both); who visits Mexican children and gives them presents (the Three Kings, Santa Claus, or both); what Mexican children eat (tacos, hamburgers, or both); what Mexican children have in their home (Mexican flag, American flag, or both); what holiday Mexican children celebrate (Day of the Dead, Halloween, or both); what sport Mexican children play (soccer, football, or both); what dance Mexican children do (ballet, folklore, or both); and what Mexican children do when they say “Hi” to someone (shake hands, kiss on the cheek, or both).
For each question, three different cards were presented: one card depicted something traditionally Mexican, another card depicted something traditionally American, and the last card depicted both. Children were asked to select the picture that represented what they thought about Mexican children. To ensure that children’s selections were not influenced by the order that cards were presented, two versions of the task were created in which the first two cards were counterbalanced for each question (i.e., whether the traditionally Mexican or traditionally American card was presented first or second). For each item, children received a score of 1 when they selected the traditionally Mexican card or the “both” card, and a score of 0 when they selected the traditionally American card. Scores range from 0–8.
Convergent validity measures.
Mothers’ nativity was coded using each mother’s report of her country of birth. The variable was coded 0 = foreign-born, 1 = U.S.-born.
Children’s self-labeling as Mexican was measured at W6 at the end of the interview (to avoid priming before the other measures were completed) by asking children the question: “Are you Mexican?” Children’s responses were coded as: 0 = no, 1 = yes.
Divergent validity measure.
Children’s effortful control was measured using mothers’ responses to the effortful control subscale from the very short version of the Child Behavior Questionnaire (Putnam & Rothbart, 2006). The 12 items (e.g., “When drawing or coloring in a book, shows strong concentration”) were scored on a 7-point Likert scale ranging from (1) Extremely false to (7) Extremely true, and higher scores indicated greater effortful control.
Analytic Approach
A multiple-step analytic approach was utilized. Analyses for Steps 1 and 3 were conducted in SPSS version 22.0 (IBM Corporation, 2013). Steps 2 and 4 were conducted in Mplus version 8.3 (Muthén & Muthén, 2017).
Step 1: Descriptive statistics.
Step 1 was descriptive, and involved examining means and standard deviations for all continuous measures, and whether measures were normally distributed, as indicated by skewness less than two and kurtosis less than seven (Tabachnick & Fidell, 2006). We also examined the frequencies for items for the full sample and separately by children’s sex and mothers’ nativity.
Steps 2–3: Factor structure and reliability.
For the attitudes measure, four primary fit indices were used to examine whether the 2-factor or 1-factor confirmatory factor analysis was a better-fitting model: the comparative fit index (CFI), the Tucker-Lewis Index (TLI), the root-mean-square-error of approximation (RMSEA), and the Weighted Root Mean Square Residual (WRMR), which is the recommended estimator for categorical variables (Liang & Yanyun, 2014). Model fit was considered to be good if the CFI and TLI were greater than or equal to .95, the RMSEA was less than or equal to .06 (Hu & Bentler, 1999) and the WRMR was less than 1 (DiStefano et al., 2018).
For the knowledge measure, an exploratory factor analysis with varimax rotation was used to determine the best-fitting factor structure of the eight items. We examined a scree plot to evaluate the number of factors that should be considered. Within each possible factor solution, items were examined, and we removed any items, one at a time, that did not load significantly (p < .05) and above .40 on a factor. In removing items, the item with the lowest loading value was removed first.
Step 3 involved testing reliability of the measures. The Kuder-Richardson Formula 20 (KR-20) coefficient of reliability was used because the response options for the aforementioned measures were categorical. In examining reliability, items were removed, one at a time, if results indicated that the reliability coefficient could be improved.
Step 4: Convergent and divergent validity of measures.
In Step 4, we tested convergent and divergent validity. To test convergent validity, we examined the correlations among the ERI measures and mothers’ nativity, and children’s self-labeling. To test divergent validity, we examined the correlation between each ERI measure and children’s effortful control.
Results
ERI Attitudes
As a preliminary step, and in an effort to reduce measurement error, we reviewed the raw data to determine whether there were cases in which participants demonstrated a lack of understanding of the task as evidenced by systematic or erratic response patterns. Because the measure includes six positive attitudes and six negative attitudes, any child who responded uniformly yes or uniformly no across all 12 items did not understand the task. Therefore, the responses for 27 children (i.e., 14.8% of the sample) on all 12 items were coded as missing to reduce error. As a follow-up, using t-tests, we compared the 27 excluded children to those who were included in analyses to test for potential differences based on mothers’ nativity, children’s self-labeling, and/or children’s effortful control. T-tests indicated differences based on mothers’ nativity, such that the children who understood the task were more likely to have mothers who were U.S.-born than the 27 children who did not understand the task, t(130) = 2.17, p = .03. There were no significant differences between the 27 children and the rest of the sample based on children’s self-labeling or children’s effortful control (p > .05).
The mean for the 6-item positive attitudes measure was 4.57 (SD = 1.49), and the measure was normally distributed, with skewness of −1.0 (SE = .24) and kurtosis of .28 (SE = .47). The mean for the 6-item negative attitudes measure was 1.54 (SD = 1.90), and the measure was normally distributed, with skewness of 1.05 (SE = .24) and kurtosis of −.16 (SE = .47). Frequencies of endorsement of a yes response for each item for positive attitudes and negative attitudes were examined for the full sample, as well as separately by mothers’ nativity and child sex (see Table 1). Chi square tests indicated there were no significant differences in any of the frequencies based on mothers’ nativity or child sex (all ps > .05).
Table 1.
Percentages for Endorsement of a Yes Response to Items in the Ethnic-Racial Identity Attitudes Measure.
| Items | Full Sample (N = 105) | Separately by Mothers’ Nativitya | Separately by Child Sex b |
|---|---|---|---|
| Positive Attitudes | |||
| This card says smart. Some children are smart. Is the Mexican girl (boy) smart? | 73% | 61% / 78% | 74% / 73% |
| This card says good. Some children are good. Is the Mexican girl (boy) good? | 83% | 79% / 84% | 84% / 82% |
| This card says pretty. Some children are pretty (handsome). Is the Mexican girl (boy) pretty (handsome)? | 85% | 89% / 83% | 90% / 80% |
| This card says clean. Some children are clean. Is the Mexican girl (boy) clean? | 81% | 75% / 83% | 80% / 82% |
| This card says friendly. Some children are friendly. Is the Mexican girl (boy) friendly? | 73% | 79% / 71% | 72% / 75% |
| This card says kind. Some children are kind. Is the Mexican girl (boy) kind? | 62% | 61% / 62% | 58% / 66% |
| Negative Attitudes | |||
| This card says ugly. Some children are ugly. Is the Mexican girl (boy) ugly? | 20% | 14% / 22% | 18% / 22% |
| This card says bad. Some children are bad. Is the Mexican girl (boy) bad? | 28% | 14% / 33% | 26% / 29% |
| This card says dumb. Some children are dumb. Is the Mexican girl (boy) dumb? | 24% | 14% / 27% | 20% / 27% |
| This card says naughty. Some children are naughty. Is the Mexican girl (boy) naughty? | 31% | 32% / 31% | 22% / 40% |
| This card says dirty. Some children are dirty. Is the Mexican girl (boy) dirty? | 28% | 29% / 27% | 26% / 29% |
| This card says mean. Some children are mean. Is the Mexican girl (boy) mean? | 24% | 11% / 29% | 20% / 27% |
Note.
Children with foreign-born mothers (n = 28) / U.S.-born mothers (n = 77)
Children who were girls (n = 50) / boys (n = 55). Percentages reported are valid percentages (i.e., only children who responded are included). The wording used for boys is in parentheses.
Based on prior work noting that positive and negative attitudes are separate constructs (e.g., Aboud, 2003), a 2-factor confirmatory factor analysis (CFA) was tested. In the 2-factor CFA, the six positive attitudes were specified on one factor, and the six negative attitudes were specified on the other factor. This 2-factor solution demonstrated good fit: χ2 (53) = 61.47, p = .20; CFI = .98; TLI = 97; RMSEA = .04 (90% CI: .00, .08); WRMR = .74. Additionally, all 6 positively worded items loaded significantly and above .40 on Factor 1, and all 6 negatively worded items loaded significantly above .40 on Factor 2 (see Table 2). The correlation between the two factors was −.64 (p < .01). As a sensitivity analysis, we tested the one-factor solution in which all 12 items were specified to load on one factor. This model did not have acceptable fit: χ2 (54) = 110.15, p < .01; CFI = .86; TLI = 83; RMSEA = .10 (90% CI: .07, .13); WRMR = 1.08. Thus, a 2-factor solution was accepted as most appropriate for the measure.
Table 2.
Confirmatory Factor Analysis for the 1-Factor and 2-Factor Solution for Ethnic-Racial Identity Atitudes Measure (N = 105)
| Items | Loadings |
|---|---|
| One-Factor Model | |
| Item 1. This card says smart. Some children are smart. Is the Mexican girl (boy) smart? | −.28 |
| Item 2. This card says good. Some children are good. Is the Mexican girl (boy) good? | −.41 |
| Item 3. This card says ugly. Some children are ugly. Is the Mexican girl (boy) ugly? | .70 |
| Item 4. This card says pretty. Some children are pretty (handsome). Is the Mexican girl (boy) pretty (handsome)? | −.69 |
| Item 5. This card says clean. Some children are clean. Is the Mexican girl (boy) clean? | −.48 |
| Item 6. This card says bad. Some children are bad. Is the Mexican girl (boy) bad? | .87 |
| Item 7. This card says friendly. Some children are friendly. Is the Mexican girl (boy) friendly? | −.46 |
| Item 8. This card says kind. Some children are kind. Is the Mexican girl (boy) kind? | −.34 |
| Item 9. This card says dumb. Some children are dumb. Is the Mexican girl (boy) dumb? | .81 |
| Item 10. This card says naughty. Some children are naughty. Is the Mexican girl (boy) naughty? | .58 |
| Item 11. This card says dirty. Some children are dirty. Is the Mexican girl (boy) dirty? | .83 |
| Item 12. This card says mean. Some children are mean. Is the Mexican girl (boy) mean? | .93 |
| Two-Factor Model | |
| Factor 1 - Positive Attitudes | |
| Item 1. This card says smart. Some children are smart. Is the Mexican girl (boy) smart? | .43 |
| Item 2. This card says good. Some children are good. Is the Mexican girl (boy) good? | .60 |
| Item 4. This card says pretty. Some children are pretty (handsome). Is the Mexican girl (boy) pretty (handsome)? | .95 |
| Item 5. This card says clean. Some children are clean. Is the Mexican girl (boy) clean? | .56 |
| Item 7. This card says friendly. Some children are friendly. Is the Mexican girl (boy) friendly? | .69 |
| Item 8. This card says kind. Some children are kind. Is the Mexican girl (boy) kind? | .57 |
| Factor 2 - Negative Attitudes | |
| Item 3. This card says ugly. Some children are ugly. Is the Mexican girl (boy) ugly? | .51 |
| Item 6. This card says bad. Some children are bad. Is the Mexican girl (boy) bad? | .63 |
| Item 9. This card says dumb. Some children are dumb. Is the Mexican girl (boy) dumb? | .59 |
| Item 10. This card says naughty. Some children are naughty. Is the Mexican girl (boy) naughty? | .43 |
| Item 11. This card says dirty. Some children are dirty. Is the Mexican girl (boy) dirty? | .60 |
| Item 12. This card says mean. Some children are mean. Is the Mexican girl (boy) mean? | .67 |
Next, we examined the reliability for positive attitudes and negative attitudes. The positive attitudes measure demonstrated fair reliability (KR-20 = .63), and results indicated that no items could be removed to improve reliability. The 6-item negative attitudes measure demonstrated adequate reliability (KR-20 = .82), and results indicated that no items could be removed to improve reliability. Thus, the original 6-item positive and negative attitudes measures were accepted as the final versions.
Regarding convergent validity, the positive attitudes measure was positively correlated with children’s self-labeling as Mexican (r = .35, p < .001), indicating that children who self-labeled as Mexican had more positive attitudes than children who did not self-label as Mexican1. The positive attitudes measure was not significantly correlated with mothers’ nativity (r = .09, p = .23). The negative attitudes measure was positively correlated with mothers’ nativity (r = .17, p = .02), indicating that children with U.S.-born mothers had relatively more negative attitudes than those with foreign-born mothers. Negative attitudes were not significantly correlated with children’s self-labeling as Mexican (r = .02, p = .79). Analyses provided evidence of divergent validity, as results indicated that neither positive attitudes (r = −.04, p = .59) nor negative attitudes (r = .03, p = .69) were correlated with children’s effortful control.
ERI Centrality
The mean for the 1-item ERI centrality measure was 2.83 (SD = 1.41) on a 5-point scale, and the measure was normally distributed, with skewness of .13 (SE = .22) and kurtosis of −1.28 (SE = .43). Frequencies for children’s selection of Mexican as being a central aspect of their ERI were examined for the full sample, as well as separately by mothers’ nativity and child sex (see Table 3). For the full sample, 16% of children selected being Mexican as the most central out of five options, 20% selected being Mexican as the second most central, 20% selected being Mexican as the third most central, 21% selected being Mexican as the fourth most central, and 24% selected being Mexican as the fifth most central out of five options. Chi-square tests indicated there were no significant differences in any of the frequencies based on mothers’ nativity or child sex (all ps > .05).
Table 3.
Percentages for Order of Selection of “Being Mexican” for the Ethnic-Racial Identity Centrality Measure.
| Items | Full Sample (N = 126) | Separately by Mothers’ Nativitya | Separately by Child Sexb |
|---|---|---|---|
| Indicated that being Mexican was the 1st most central out of 5 options | 16% | 15% / 17% | 18% / 14% |
| Indicated that being Mexican was the 2nd most central out of 5 options | 20% | 24% / 18% | 25% / 16% |
| Indicated that being Mexican was the 3rd most central out of 5 options | 20% | 12% / 24% | 14% / 24% |
| Indicated that being Mexican was the 4th most central out of 5 options | 21% | 27% / 18% | 16% / 24% |
| Indicated that being Mexican was the 5th most central out of 5 options | 24% | 22% / 25% | 27% / 21% |
Note.
Children with foreign-born mothers (n = 41) / U.S.-born mothers (n = 85)
Children who were girls (n = 50) / boys (n = 55). Percentages reported are valid percentages (i.e., only children who responded are included).
Regarding convergent validity, the centrality measure was positively correlated with children’s self-labeling as Mexican (r = .33, p < .001), indicating that children who self-labeled as Mexican had higher centrality than children who did not self-label as Mexican. The centrality measure was not significantly associated with mothers’ nativity (r =.00, p = .99). Analyses provided evidence of divergent validity, given that the centrality measure was not significantly correlated with children’s effortful control (r = −.06, p = .42).
ERI Knowledge
The mean for the ERI knowledge scale was 4.65 (SD = 1.51) on an 8-point scale, and the measure was normally distributed, with skewness of .21 (SE = .21) and kurtosis of −.28 (SE = .42). Frequencies were examined for the full sample, as well as separately by mothers’ nativity and child sex (see Table 4). Chi-square tests indicated that the only significant difference in frequencies was that girls endorsed the traditionally Mexican or both card for the food item (i.e., “What do you think Mexican children eat?) significantly more than boys (i.e., 68% of girls compared to 49% of boys).
Table 4.
Percentages for the Items in the Ethnic-Racial Identity Knowledge Measure for Children who Selected the Card that Depicted Something that was Traditionally Mexican or the Card that Depicted Something Traditionally Mexican and Something Traditionally American.
| Items | Full Sample (N = 132) | Separately by Mothers’ Nativitya | Separately by Child Sexb |
|---|---|---|---|
| Item 1. What do you think Mexican children do at their birthday parties? | 85% | 93% / 81% | 86% / 84% |
| Item 2. Who do you think visits Mexican children and gives them presents? | 21% | 22% / 20% | 17% / 23% |
| Item 3. What do you think Mexican children eat? | 58% | 56% / 58% | 68% / 49% |
| Item 4. What flag do you think Mexican children have in their home? | 46% | 44% / 47% | 42% / 49% |
| Item 5. What holiday do you think Mexican children celebrate? | 68% | 71% / 67% | 64% / 71% |
| Item 6. What sport do you think Mexican children play? | 64% | 61% / 66% | 73% / 58% |
| Item 7. What dance do you think Mexican children do? | 72% | 71% / 73% | 64% / 78% |
| Item 8. What do you think Mexican children do when they say ‘Hi’ to someone? | 52% | 51% / 52% | 56% / 48% |
Note.
Children with foreign-born mothers (n = 41) / U.S.-born mothers (n = 91)
Children who were girls (n = 50) / boys (n = 55). Percentages reported are valid percentages (i.e., only children who responded are included). Percentages that are significantly different (p < .05) are bolded.
The exploratory factor analysis on the 8-item knowledge measure indicated that three factors had eigenvalues greater than 1 (i.e., 1.91 for Factor 1, 1.53 for Factor 2, 1.43 for Factor 3; see Table 5). However, in examining the 2-factor and 3-factor solutions, some of the items within each factor only included one item that loaded significantly and above .40 on the factor. Given that no factor can have only one item, both the 2-factor and the 3-factor solution were not considered. Thus, we moved forward with a 1-factor solution. Given that only 3 items in the 1-factor solution loaded significantly and above .40 (i.e., Items 2, 5, and 8 in Table 4), all other items were removed, and the exploratory factor analysis was conducted again with only these 3 items. With only three items, results from this second exploratory factor analysis indicated that there was one eigenvalue greater than 1 (i.e., 1.77), and examination of the scree plot supported a 1-factor solution. All items loaded significantly (p < .05) and above .40 on the factor. Therefore, a 1-factor solution with 3 items was accepted as the best solution for the knowledge measure.
Table 5.
Exploratory Factor Analysis for the Ethnic-Racial Identity Knowledge Measure (N = 132)
| Items | 1-Factor Solution | 2-Factor Solution | 3-Factor Solution | |||
|---|---|---|---|---|---|---|
| Item 1. What do you think Mexican children do at their birthday parties? | −.13 | −.27 | .11 | −.56 | .61 | .01 |
| Item 2. Who do you think visits Mexican children and gives them presents? | .65 | .90 | .00 | .87 | −.02 | .01 |
| Item 3. What do you think Mexican children eat? | .05 | −.08 | .14 | −.13 | .16 | .11 |
| Item 4. What flag do you think Mexican children have in their home? | .20 | .22 | .02 | .03 | .58 | −.13 |
| Item 5. What holiday do you think Mexican children celebrate? | .70 | .08 | .88 | .29 | .01 | .78 |
| Item 6. What sport do you think Mexican children play? | −.10 | .28 | −.40 | −.00 | .60 | −.62 |
| Item 7. What dance do you think Mexican children do? | .23 | −.37 | .61 | −.22 | −.01 | .57 |
| Item 8. What do you think Mexican children do when they | .53 | .46 | .11 | .47 | .06 | .08 |
| say ‘Hi’ to someone? | ||||||
| % Variance Explained | 16.46 | 17.94 | 13.36 | 10.23 | 18.20 | 13.21 |
Note. Varimax rotation was used. Loadings that are significant (p < .05) and above .40 are bolded.
However, the 3-item measure did not demonstrate good reliability (KR-20 = .44). Additionally, given that the measure only consisted of 3 items, no additional items could be removed from the measure. The mean for the final 3-item measure was 1.40 (SD = .95) on an 8-point scale, and the measure was normally distributed, with skewness of .15 (SE = .21) and kurtosis of −.86 (SE = .42).
Regarding convergent validity, the knowledge measure was positively correlated with children’s self-labeling as Mexican (r = .21, p < .01), indicating that children who self-labeled as Mexican had more knowledge than children who did not self-label as Mexican. The knowledge measure was not significantly associated with mothers’ nativity (r = −.04, p = .59). Analyses provided evidence of divergent validity, given that that the measure was not significantly correlated with children’s effortful control for the full sample (r = .10, p = .18).
Discussion
Children as young as four years of age are aware of ethnicity and race (Ausdale & Feagin, 2001) and use ethnicity-race as a meaningful category to understand others (e.g., Bennett & Sani, 2003; Waxman, 2010), but prior work has primarily examined ERI among older children and adolescents. Thus, the first goal of this study was to describe measures that are developmentally appropriate for assessing young children’s ERI attitudes, centrality, and knowledge. The second goal was to test the psychometric properties of each of the three measures. Overall, our findings provided initial support for the construct validity and reliability of several of the measures, but highlight important areas for additional investigation. Below, findings, limitations, and future directions are reviewed for each measure.
ERI Attitudes
Attitudes, which have been posited to be an important aspect of children’s ERI (Bernal et al., 1990), have been commonly assessed with the PRAM II (Williams et al., 1975). The present study built on Kowalski’s (2003) and Stokes-Guinan’s (2011) changes to the methodology and scoring of the PRAM II by encouraging Mexican-heritage children to select their own representation of Mexican, translating the measure into Spanish, and testing the psychometric properties of the measure. First, consistent with Stokes-Guinan’s (2011) contention that endorsing a positive statement is not the same as not endorsing a negative statement, our findings supported a two-factor solution for positive and negative attitudes. Together, these findings suggest that future work should use separate subscales to assess children’s positive attitudes and negative attitudes about their ethnicity-race.
Findings also indicated that the 6-item negative attitudes measure reliably assessed the construct. However, the reliability for the 6-item positive attitudes measure was lower than the typically recommended cut-off for reliability (.70; Cronbach, 1951). Interestingly, research on adolescents’ ERI attitudes using survey measures (referred to as ERI affirmation, private regard, or pride) has also reported similar levels of reliability (e.g., .64; Davis et al., 2017). Scholars have noted that items on the positive attitudes measure are more likely to be endorsed because individuals tend to have more positive attitudes compared to negative attitudes, resulting in more limited variability and thus lower reliability coefficients (Sellers et al., 1997). Similarly, in the present study, the majority of children endorsed the positive attitudes items (i.e., 62% to 85% across the items), whereas relatively fewer children endorsed the negative attitudes items (i.e., 20% to 31% across the items). Thus, our findings with children tend to map onto findings with adolescents, such that there is more variability in negative attitudes than positive attitudes, which could explain the relatively lower reliability estimate.
Our findings provided some initial support for the construct validity of positive and negative attitudes. First, support for divergent validity was documented because neither measure was associated with effortful control. In support of convergent validity and consistent with theoretical expectations (Knight, et al., 1993), the positive attitudes measure was positively associated with children’s self-labeling as Mexican, and the negative attitudes measure was positively associated with mothers’ nativity (children of U.S.-born mothers had higher negative attitudes compared to children of mothers born outside the U.S.). However, contrary to expectations, the positive attitudes measure was not significantly associated with mothers’ nativity and the negative attitudes measure was not associated with children’s self-labeling. The different findings for convergent validity further support that higher positive attitudes do not necessarily mean lower negative attitudes, but rather that positive and negative attitudes are different constructs. Future work is needed that continues to test convergent validity for both positive and negative attitudes.
ERI Centrality
ERI centrality is posited to form during childhood (e.g., Umaña-Taylor et al., 2014); however, the majority of prior work has focused on this construct during adolescence (e.g., Okeke et al., 2009; Rivas-Drake, 2011). Thus, we built on an identity ranking task from one of the few studies that examined this construct among school age children (Turner & Brown, 2007). Specifically, we adapted the task to be more developmentally appropriate for young children by showing children a blindfolded puppet at the beginning of the task and explaining that they would be describing themselves to the puppet who could not see them. In addition, we only used social categories (i.e., boy/girl, Mexican, son/daughter, friend, and five-year-old) as options. Using both social identities (e.g., sex, ethnicity-race, age) and preferences (e.g., pets, sports, computers) as options, Turner and Brown (2007) found that children rated ethnicity-race as least central among the six options. However, results from the present study, in which only social categories were used, indicated that there was significant variability in children’s ERI centrality. For example, 16% of children indicated that being Mexican was the most central out of the 5 options, whereas 24% indicated that being Mexican was the least central. Thus, findings suggest that there is value to limiting children’s choices in this task if the goal is to rank ERI as an important (or central) part of the self.
This finding moves the field forward by demonstrating that when interested in assessing children’s ERI centrality, a social construct, scholars should use assessments that only include social categories. Additionally, this finding provides initial support for scholars’ contention that centrality begins to form during childhood (e.g., Umaña-Taylor et al., 2014), by demonstrating that even as early as 5 years of age, some children are already beginning to think about ethnicity-race as an important aspect of their self-concept. Given the variability that emerged in our sample, it will be important for future work to investigate predictors that may inform this variability.
With respect to construct validity of the ERI centrality measure, findings provided mixed support. Divergent validity was supported because ERI centrality was not associated with effortful control. Support for convergent validity emerged with the expected positive association between ERI centrality and children’s self-labeling as Mexican; however, ERI centrality was not significantly associated with mothers’ nativity. Although little work has assessed ERI centrality among children, expectations regarding validity were based on theoretical expectations (i.e., Knight et al., 1993) and prior empirical work with other forms of ERI, such as attitudes (Bernal et al., 1990). It is possible that ERI centrality is associated with other constructs that we were unable to assess in the present study, such as preparation for bias messages from parents or discrimination experiences.
Given that ERI centrality was associated with self-labeling as Mexican, it is possible that during this developmental period, ethnicity and race may become central to the majority of children after they self-label. Indeed, in related literature on gender identity, scholars have posited that after children self-label their gender, they develop more detailed schemas about gender, which affects their feelings about their gender (Martin, 1991). This is not to say that ERI centrality is not important for 5-year-old children, because, as noted, over one-third of the sample indicated that being Mexican was the first or second most important category to their self-concept. However, it will be important for future studies with larger samples of children across older ages (e.g., 5 to 7 years old) to assess whether children’s ERI centrality increases as they age and as they increasingly self-label as a member of their group.
ERI Knowledge
Prior work (e.g., Bernal et al., 1990; Knight et al., 1993) assessed ERI knowledge by asking children to report the likelihood that particular events (e.g., eating menudo) would occur in a hypothetical Mexican town. However, given that children who were born, raised, and/or living in the U.S. are also involved in mainstream U.S. American culture, children’s knowledge of Mexican culture may include both traditionally Mexican and traditionally American components. Thus, the present study adapted the measure by not only including a response option that depicted something traditionally Mexican and a response option that depicted something traditionally American, but we also included a third response option that depicted both.
Results from the exploratory factor analysis supported a one-factor solution, but only 3 items fit well on the factor. Further, reliability was low for the measure using these three items. Divergent validity was supported, but minimal evidence was provided for convergent validity because the knowledge measure was only associated with children’s self-labeling as Mexican. It is possible that this measure may be too cognitively complex for 5-year-old children, and may be more appropriate for children who have already developed the ability to self-label as Mexican.
It is also possible that children did not understand the task and chose the “both” card to indicate a response of Mexican-only or American-only because the card featured both pictures. In other words, the findings could have been due to the developmental period (in which 5-year-old children in general are still developing their ERI knowledge), or due to measurement issues with the “both” card. In order to disentangle this possibility, future work could include a sample of 5- to 7-year old children, but provide half of the children with the three cards used in the present study, and provide the other half of the sample with only the Mexican card and the American card (i.e., exclude the both card). Then, scholars could examine whether younger children understand the task when only two response options are used, and whether more support for construct validity and reliability emerges when the “both” card is excluded. The current findings provided useful preliminary information regarding the ERI knowledge measure, but underscored the need for further development and assessment with this measure and construct.
Limitations and Future Directions
The present study makes important contributions to the literature but is not without limitations. First, the current sample was limited to children born to adolescent mothers. The unique nature of the sample may limit the generalizability of the current findings and emphasize the need for replication. Second, the measures were tested only among Mexican-heritage families and will need to be examined with children from other ethnic-racial groups, including Latinx populations from other national origin groups, to determine generalizability. Further, data were collected in 2012–2013 in Arizona, which occurred in the years following the enactment of the “Supporting Our Law Enforcement and Safe Neighborhoods Act” (SB 1070), which led to increased racial-profiling and fear among Mexican-heritage families (Ayón, & Becerra, 2013). The lifespan model of ERI (Williams et al., 2020) conceives that ERI development is influenced by the local current context, which may have impacted the current findings. In the current study, for example, this local current context may have led to relatively greater salience of children’s ethnic-racial background and perhaps increased centrality than would have been evidenced at a different point in history in Arizona or at the same point in history but in a different geographical region that was not experiencing this form of sociopolitical assault. It will be important for future studies to continue to test these ERI measures across varying local current contexts to more comprehensively understand children’s ERI development.
Additionally, although a video was shown to children to orient them to the term Mexican, no video comprehension questions were asked to children after the video. It is possible that children did not understand the content of the video or the term Mexican, and thus they could have selected the doll that they liked most, rather than the one they viewed as Mexican. Future studies should include follow-up questions after the video to assess comprehension. Finally, although initially planned, we were unable to examine language measurement invariance because the sample size for children who completed measures in Spanish was too small (i.e., n = 43) to support these analyses. It will be important for future work to test language invariance of the measures with larger samples. Given that many Latinx children in the U.S. are raised in households that speak mainly Spanish or both Spanish and English (Krogstead & Gonzalez-Barrera, 2015), it is critical to have two versions of the measures that can be administered by researchers in Spanish and English.
Despite these limitations, the present study makes a valuable contribution to the field. As conceived in the lifespan model of ERI (Williams et al., 2020), early childhood is an important time for ERI development but a developmental period that has received less attention in the literature, possibly due to a lack of reliable and valid measures to assess the multidimensional aspects of ERI. By using the ERI measures in the current study and continuing to refine them, scholars will be able to better understand the role that ERI plays in children’s development and how we can best support positive adjustment. In the current study, we provided important descriptive data for three components of 5-year-old Mexican-heritage children’s ERI and highlighted numerous directions for future research. We provided initial data on the potential feasibility of using the three adapted assessment tools among children as young as 5 years of age. Importantly, all three measures involve direct assessment with children, and are therefore not subject to the bias of parent report. Overall, given the paucity of studies that have examined ERI in early childhood, the results from the current study have the potential to stimulate growth of knowledge in this area.
Highlights.
We test newly adapted measures of ethnic-racial identity attitudes, centrality, & knowledge.
The ERI attitudes measure supported 2 factors: positive and negative attitudes.
The ERI centrality measure demonstrated initial reliability and validity.
The ERI knowledge measure supported a 1-factor solution with 3 items.
The study calls attention to the importance of assessing ERI in early childhood.
Acknowledgments
Author Note
This research was supported by grants from the Department of Health and Human Services (APRPA006011; PI: Umaña-Taylor), the Fahs Beck Fund for Research and Experimentation of the New York Community Trust (PI: Umaña-Taylor), the National Institute of Child Health and Human Development (R01HD061376; PI: Umaña-Taylor and 1F31HD085772-01; PI: Chelsea Derlan) and the Challenged Child Project of the T. Denny Sanford School of Social and Family Dynamics at Arizona State University. Chelsea D. Williams’ efforts on this article were partially supported by Virginia Commonwealth University’s Institute for Inclusion, Inquiry & Innovation (iCubed). We thank the adolescent mothers and female family members who participated in this study. We also thank Edna Alfaro, Mayra Bámaca, Diamond Bravo, Emily Cansler, Lluliana Flores, Melinda Gonzales-Backen, Elizabeth Harvey, Melissa Herzog, Sarah Killoren, Ethelyn Lara, Esther Ontiveros, Jacqueline Pflieger, Alicia Godinez, and the undergraduate research assistants of the Supporting MAMI project for their contributions to the larger study.
Appendix
Appendix
Script of the video in Spanish that was created to orient children to the word Mexican. The video featured two puppets, Tomás and María, who engaged in dialogue. Instructions to the voice actors are in italicized English.
Tomás: ¡Hola María!
María: ¡Hola Tomás!
Tomás: ¿Cómo estás?
María: ¡Estoy bien! ¿Tú cómo estás?
Tomás: Yo estoy bien, pero tengo una pregunta para ti María. ¿Sabes lo que quiere decir la palabra mexicano (emphasize this word)?
María: ¿Mexicano?
Tomás: ¡Sí, mexicano!
María:. Sí, yo sé lo que la palabra mexicano quiere decir. Mexicano significa una persona que su familia es de México.
Tomás: ¿Tú eres mexicana?
María: Sí, yo soy mexicana. Hace mucho tiempo, mi abuela vino desde México, hasta aquí donde ahora vivo. Parte de mi familia todavía vive en México, y algunas veces los vamos a visitar. ¡Está muy lejos, así que tenemos que viajar en coche mucho tiempo o tenemos que tomar un avión para ir a verlos! Te voy a mostrar Tomás (look at map). Yo vivo aquí (point to area on map in U.S. with puppet arm), y parte de mi familia vive en México (point to area on map in México). Nos metemos en un coche y manejamos para verlos, o nos subimos a un avión y volamos para verlos. A toda mi familia y a mí nos llaman mexicanos porque mi abuela vino desde México. Otras personas pueden ser mexicanos porque nacieron en México y luego se mudaron.
Tomás: ¡Ah, OK María! (close mouth and pause). Pero tengo otra pregunta. Nadie de mi familia vive en México, todos viven en Arizona, pero hace mucho mucho MUCHO tiempo, la abuela de mi abuela vino desde México. ¿Todavía soy mexicano?
María: ¡Sí Tomás, todavía eres mexicano!
Tomás: Ah OK, ahora sé lo que significa ser mexicano. Mexicano significa una persona que su familia es de México, así que yo soy mexicano. ¡Gracias María, me tengo que ir porque mi mamá está haciendo la cena!
María: ¡OK Tomás, nos vemos luego!
Tomás: ¡Adiós María!
María: ¡Adiós Tomás! (Both puppets exit in opposite directions)
Footnotes
When a Pearson correlation is used to examine the relation between a binary variable that is dummy coded 0/1 and a continuous variable (as is the case in our current analyses), the result is the same as what is achieved when conducted as a t-test (i.e., the t-statistic is a function of the correlation coefficient and the p-value is the same)
Publisher's Disclaimer: This is a PDF file of an unedited manuscript that has been accepted for publication. As a service to our customers we are providing this early version of the manuscript. The manuscript will undergo copyediting, typesetting, and review of the resulting proof before it is published in its final form. Please note that during the production process errors may be discovered which could affect the content, and all legal disclaimers that apply to the journal pertain.
References
- Aboud FE (2003). The formation of in-group favoritism and out-group prejudice in young children: Are they distinct attitudes? Developmental Psychology, 39(1), 48–60. doi: 10.1037/0012-1649.39.1.48 [DOI] [PubMed] [Google Scholar]
- Aboud FE, & Skerry SA (1983). Self and ethnic concepts in relation to ethnic constancy. Canadian Journal of Behavioural Science/Revue Canadienne Des Sciences Du Comportement, 15(1), 14–26. doi: 10.1037/h0080675 [DOI] [Google Scholar]
- Ausdale DV & Feagin JR (2001). The first R: How children learn race and racism. United Kingdom: Rowman & Littlefield Publishers, Inc. [Google Scholar]
- Ayón C, & Becerra D (2013). Mexican immigrant families under siege: The Impact of anti-immigrant policies, discrimination, and the economic crisis. Advances in Social work, 14, 206–228. doi: 10.18060/2692 [DOI] [Google Scholar]
- Bennett M, & Sani F (2003). The role of target gender and race in children’s encoding of category-neutral person information. British Journal of Developmental Psychology, 21(1), 99–112. doi: 10.1348/026151003321164645 [DOI] [Google Scholar]
- Bernal ME, Knight GP, Garza CA, Ocampo KA, & Cota MK (1990). The development of ethnic identity in Mexican American children. Hispanic Journal of Behavioral Sciences, 12(1), 3–24. doi: 10.1177/07399863900121001 [DOI] [Google Scholar]
- Berry JW (2003). Origins of cross-cultural similarities and differences in human behavior: An ecocultural perspective. In Toomela A (Ed.), Cultural guidance in the development of the human mind: Advances in child development within culturally structured environments (pp. 97–109). Westport, CT: Ablex. [Google Scholar]
- Bigler RS, & Liben LS (1993). A cognitive-developmental approach to racial stereotyping and reconstructive memory in Euro-American children. Child Development, 64(5), 1507–1518. doi: 10.2307/1131549 [DOI] [Google Scholar]
- Byrd CM (2012). The measurement of racial/ethnic identity in children: A critical review. Journal of Black Psychology, 38(1), 3–31. doi: 10.1177/0095798410397544 [DOI] [Google Scholar]
- Cronbach LJ (1951). Coefficient alpha and the internal structure of tests. Psychometrika, 16(3), 297–334. doi: 10.1007/bf02310555 [DOI] [Google Scholar]
- Clark KB, & Clark MP (1939). The development of consciousness of self and the emergence of racial identification in Negro preschool children. Journal of Social Psychology, 10(4), 591–599. doi: 10.1080/00224545.1939.9713394 [DOI] [Google Scholar]
- Clark KB & Clark MP (1947). Racial identification and preference in Negro children. In Newcomb TM & Hartley EL (Eds.), Reading in social psychology (pp. 169–178). New York: Holt, Rinehart & Winston. [Google Scholar]
- Davis BL, Smith-Bynum MA, Saleem FT, Francois T, & Lambert SF (2017). Racial socialization, private regard, and behavior problems in African American youth: Global self-esteem as a mediator. Journal of Child and Family Studies, 26(3), 709–720. doi: 10.1007/s10826-016-0601-8 [DOI] [PMC free article] [PubMed] [Google Scholar]
- DiStefano C Liu J Jiang N & Shi D (2018) Examination of the weighted root mean square residual: Evidence for trustworthiness? Structural Equation Modeling: A Multidisciplinary Journal, 25(3), 453–466. doi: 10.1080/10705511.2017.1390394 [DOI] [Google Scholar]
- Dulin-Keita A, Hannon L, Fernandez JR, & Cockerham WC (2011). The defining moment: Children’s conceptualization of race and experiences with racial discrimination. Ethnic and Racial Studies, 34(4), 662–682. doi: 10.1080/01419870.2011.535906 [DOI] [PMC free article] [PubMed] [Google Scholar]
- Epstein I, Stevens B, McKeever P, Baruchel S, & Jones H (2008). Using puppetry to elicit children’s talk for research. Nursing Inquiry, 15(1), 49–56. doi: 10.1111/j.14401800.2008.00395.x [DOI] [PubMed] [Google Scholar]
- Gonzalez NA, Fabrett FC, & Knight GP (2009). Acculturation, enculturation, and the psychosocial adaptation of Latino youth. In Villarruel FA, Carlo G, Grau JM, Azmitia M, Cabrera NJ, & Chahin TJ (Eds.), Handbook of U.S. Latino psychology: Developmental and community-based perspectives (pp. 115–134). Thousand Oaks, CA: Sage. [Google Scholar]
- Hu L, & Bentler PM (1999). Cutoff criteria for fit indices in covariance structure analysis: Conventional criteria versus new alternatives. Structural Equation Modeling, 6(1), 1–55. doi: 10.1080/10705519909540118 [DOI] [Google Scholar]
- IBM Corporation (2013). IBM SPSS Statistics for Windows, Version 22.0. Armonk, NY: IBM Corp. [Google Scholar]
- Katz PA, & Kofkin JA (1997). Race, gender, and young children. In Luthar SS, Burack JA, Cicchetti D, & Weisz JR (Eds.), Developmental psychopathology: Perspectives on adjustment, risk, and disorder (pp. 51–74). New York: Cambridge University Press. [Google Scholar]
- Knight GP, Bernal ME, Garza CA, Cota MK, Ocampo KA (1993). Family socialization and the ethnic identity of Mexican American children. Journal of Cross-Cultural Psychology, 24(1), 99–114. doi: 10.1177/0022022193241007 [DOI] [Google Scholar]
- Knight GK, Roosa MW, & Umaña-Taylor AJ (2009). Studying ethnic minority and economically disadvantaged populations. Washington D.C: APA. [Google Scholar]
- Kowalski K (2003). The emergence of ethnic and racial attitudes in preschool-aged children. The Journal of Social Psychology, 143(6), 677–690. doi: 10.1080/00224540309600424 [DOI] [PubMed] [Google Scholar]
- Krogstead JM (2019). A view of the nation’s future through kindergarten demographics. Retrieved from the Pew Research Center: https://www.pewresearch.org/fact-tank/2019/07/31/kindergarten-demographics-in-us/
- Krogstead JM & Gonzalez-Barrera A (2015). A majority of English-speaking Hispanics in the U.S. are bilingual. Retrieved from the Pew Research Center: http://www.pewresearch.org/fact-tank/2015/03/24/a-majority-of-english-speaking-hispanics-in-the-u-s-are-bilingual/
- Liang X & Yanyun Y (2014). An evaluation of WLSMV and Bayesian methods for confirmatory factor analysis with categorical indicators. International Journal of Quantitative Research in Education, 2(1), 17–38. doi: 10.1504/IJQRE.2014.060972 [DOI] [Google Scholar]
- Martin CL (1991). The role of cognition in understanding gender effects. In Reese HW (Ed.), Advances in child development and behavior (pp. 113–149). San Diego, CA: Academic Press. [DOI] [PubMed] [Google Scholar]
- Muthén B, & Muthén L (2017). MPlus, v. 8.1. Los Angeles, CA: Muthén & Muthén. [Google Scholar]
- Okeke NA, Howard LC, Kurtz-Costes B, & Rowley SJ (2009). Academic race stereotypes, academic self-concept, and racial centrality in African American youth. Journal of Black Psychology, 35(3), 366–387. doi: 10.1177/0095798409333615 [DOI] [PMC free article] [PubMed] [Google Scholar]
- Padilla AM (2006). Bicultural social development. Hispanic Journal of Behavioral Sciences, 28(4), 467–497. doi: 10.1177/0739986306294255 [DOI] [Google Scholar]
- Phinney JS (1992). The Multigroup Ethnic Identity Measure: A new scale for use with diverse groups. Journal of Adolescent Research, 7(2), 156–176. doi: 10.1177/074355489272003 [DOI] [Google Scholar]
- Putnam SB, & Rothbart MK (2006). Development of short and very short forms of the Children’s Behavior Questionnaire. Journal of Personality Assessment, 87(1), 103–113. doi: 10.1207/s15327752jpa8701_09 [DOI] [PubMed] [Google Scholar]
- Quintana SM (1994). A model of ethnic perspective-taking ability applied to Mexican-American children and youth. International Journal of Intercultural Relations, 18(4), 419–448. doi: 10.1016/0147-1767(94)90016-7 [DOI] [Google Scholar]
- Rivas-Drake D (2011). Ethnic-racial socialization and adjustment among Latino college students: The mediating roles of ethnic centrality, public regard, and perceived barriers to opportunity. Journal of Youth and Adolescence, 40(5), 606–619. doi: 10.1007/s10964-010-9564-z [DOI] [PubMed] [Google Scholar]
- Rivas-Drake D, Hughes D, & Way N (2009). A preliminary analysis of associations among ethnic–racial socialization, ethnic discrimination, and ethnic identity among urban sixth graders. Journal of Research on Adolescence, 19(3), 558–584. doi: 10.1111/j.1532-7795.2009.00607.x [DOI] [Google Scholar]
- Rivas-Drake D, Seaton EK, Markstrom C, Quintana S, Syed M, Lee RM, Schwartz SJ, Umaña-Taylor AJ, French S, Yip T & the Ethnic and Racial Identity in the 21st Century Study Group. (2014). Ethnic and racial identity in adolescence: Implications for psychosocial, academic, and health outcomes. Child Development, 85(1), 40–57. [DOI] [PMC free article] [PubMed] [Google Scholar]
- Rogers LO, Kiang L, White L, Calzada EJ, Umaña-Taylor AJ, Byrd CM, Williams CD, Marks A, & Whitesell NA (2020). Persistent concerns: Questions for research on ethnic-racial identity development. Research in Human Development, 17(2–3), 130–153. doi: 10.1080/15427609.2020.1831881 [DOI] [PMC free article] [PubMed] [Google Scholar]
- Scottham KM, Sellers RM., & Nguyên HX (2008). A measure of racial identity in African American adolescents: The development of the Multidimensional Inventory of Black Identity - Teen. Cultural Diversity and Ethnic Minority Psychology, 14(4), 297–306. doi: 10.1037/1099-9809.14.4.297 [DOI] [PMC free article] [PubMed] [Google Scholar]
- Sellers RM, Rowley SA, Chavous TM, Shelton JN, & Smith MA (1997). Multidimensional Inventory of Black Identity: A preliminary investigation of reliability and construct validity. Journal of Personality and Social Psychology, 73(4), 805. doi: 10.1037/0022-3514.73.4.805 [DOI] [Google Scholar]
- Spencer MB (2008). Lessons learned and opportunities ignored since Brown v. Board of Education: Youth development and the myth of a color-blind society. Educational Researcher, 37(5), 253. doi: 10.3102/0013189X08322767 [DOI] [Google Scholar]
- Stokes-Guinan K (2011). Age and skin tone as predictors of positive and negative racial attitudes in Hispanic children. Hispanic Journal of Behavioral Sciences, 33(1), 3–21. doi: 10.1177/0739986310389303 [DOI] [Google Scholar]
- Tabachnick BG, & Fidell LS (2006). Using multivariate statistics (5th ed.). Boston, MA: Allyn and Bacon. [Google Scholar]
- Tajfel H, & Turner TC (1986). The social identity theory of intergroup behavior. In Worchel S & Austin WC (Eds.), Psychology of intergroup relations (pp. 7–24). Chicago: Nelson-Hall. [Google Scholar]
- Turner KL, & Brown CS (2007). The centrality of gender and ethnic identities across individuals and contexts. Social Development, 16(4), 700–719. doi: 10.1111/j.1467-9507.2007.00403.x [DOI] [Google Scholar]
- Umaña-Taylor AJ, Quintana SM, Lee RM, Cross WE Jr, Rivas-Drake D, Schwartz SJ, Syed M, Yip T, Seaton E, & the Ethnic and Racial Identity in the 21st Century Study Group. (2014). Ethnic and racial identity during adolescence and into young adulthood: An integrated conceptualization. Child Development, 85(1), 21–39. [DOI] [PMC free article] [PubMed] [Google Scholar]
- Umaña-Taylor AJ, Updegraff KA, Jahromi LB, & Zeiders KH (2015). Trajectories of ethnic-racial identity and autonomy among Mexican-origin adolescent mothers in the United States. Child Development, 86(6), 2034–2050. doi: 10.1111/cdev.12444 [DOI] [PMC free article] [PubMed] [Google Scholar]
- Waxman SR (2010). Names will never hurt me? Naming and the development of racial and gender categories in preschool-aged children. European Journal of Social Psychology, 40(4), 593–610. doi: 10.1002/ejsp.732 [DOI] [Google Scholar]
- Williams JE, Best DL, & Boswell DA (1975). The measurement of children’s racial attitudes in the early school years. Child Development, 46(2), 494–500. doi: 10.2307/1128147 [DOI] [Google Scholar]
- Williams CD, Byrd CM, Quintana SM, Anicama C, Kiang L, Umaña-Taylor AJ, Calzada EJ, Pabón Gautier MC, Ejesi K, Tuitt NR, Martinez-Fuentes S, White L, Marks AK, Rogers LO, & Whitesell N. (2020). A lifespan model of ethnic-racial identity. Research in Human Development, 17(2–3), 99–129. doi: 10.1080/15427609.2020.1831882 [DOI] [PMC free article] [PubMed] [Google Scholar]