
Table 3.
Inhibition profile against T. brucei and in vitro ADME profile of C-6 substituted purines

| |||||||
|---|---|---|---|---|---|---|---|
| Entry | R1 | R2 | T. brucei pEC50a / Log fold Selectivityb | T. brucei LLEc | Aq. sol. (μM) | Human Liver Microsome CLint (uL/min/mg protein) | Rat hepatocyte CLint (uL/min/106 cells) |
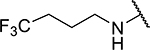
| 5a |

|
A | 6.0 / >1.4 | 5.0 | 621 | 39 | 79 |
| 5b |

|
A | 7.2 / >2.3 | 5.0 | 515 | 135 | 29 |
| 5c |

|
A | 7.5 / >2.9 | 4.1 | 159 | 300 | 136 |
| 5d |

|
A | 8.0 / >3.7 | 4.0 | 21 | 282 | 62 |
| 5e |
|
A | 7.9 / >3.6 | 4.7 | 32 | 300 | 80 |
| 5f |

|
A | 7.2 / >2.9 | 4.8 | 55 | 69 | 6.0 |
| 5g |

|
A | 5.9 / >1.6 | 4.5 | 389 | 66 | 45 |
| 5h |

|
A | 7.5 / >3.2 | 4.1 | 34 | 139 | 65 |
| 5i |

|
A | 7.7 / >3.4 | 3.2 | 34 | 81 | 19 |
| 5j |

|
A | 6.3 / >2.0 | 1.8 | 855 | 47 | 45 |
| 5k |

|
A | 7.4 / >3.1 | 1.7 | 23 | 95 | 24 |
| 5l |

|
A | 7.3 / >3.0 | 1.9 | 24 | 93 | 123 |
| 5m |

|
A | 6.9 / >2.6 | 1.8 | 87 | 24 | 12 |
| 5n |

|
A | 7.2 / >2.9 | 3.0 | 57 | 87 | 38 |
| 5o |

|
A | 7.0 / >2.7 | 4.0 | 407 | 191 | 28 |
| 5p |

|
A | 7.4 / >3.1 | 4.5 | 53 | 96 | 65 |
| 5q |

|
A | 7.1 / >2.5 | 4.4 | 304 | 46 | 10 |
| 5r |

|
A | 7.1 / >2.2 | 4.7 | 204 | 137 | 215 |
| 5s |

|
A | 7.7 / >3.4 | 5.0 | 95 | 258 | 107 |
| 5t |

|
A | 7.6 / 3.1 | 4.5 | 33 | 138 | 38 |
| 5u |

|
A | 5.9 / >1.6 | 3.3 | 544 | 10 | 6.7 |
| 5v |

|
B | 7.1 / >2.8 | 4.5 | 35 | 18 | 13 |
| 5w |

|
B | 6.6 / >2.3 | 5.3 | >1000 | 56 | 66 |
| 5x |

|
B | 7.5 / >3.2 | 2.8 | 41 | 27 | 86 |
| 5y |

|
B | 7.4 / >3.1 | 4.0 | 459 | 186 | 48 |
| 5z |

|
B | 6.4 / >2.1 | 2.6 | >1000 | 36 | 17 |
| 5aa | -NH2 | C | <4.4 | 5.7 | >1000 | 33 | 45 |
a
pEC50=−logEC50
b
Log fold selectivity = T. brucei pEC50-MRC5 pTC50
c
LLE (lipophilic ligand efficiency) = pEC50-clogP
Additional ADME data, including Log D7.4 and human plasma protein binding, are included in Table S1 of the supporting information. All SD within ±0.11