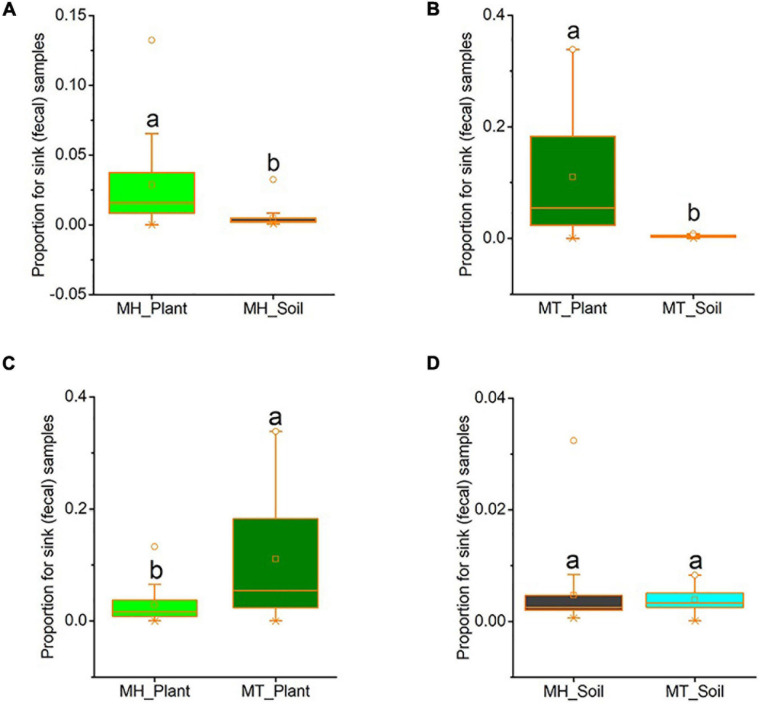
FIGURE 4.
The proportion of gut fungi present in plant samples and soil samples. (A) Comparison between plant and soil at MH. (B) Comparison between plant and soil at MT. (C) Comparison between the two sites of plant samples. (D) Comparison between the two sites of soil samples. Plant and soil contributions to the gut mycobiome at each site were identified using Source tracker. Significance was set at the 0.05 level. Latters represnt significant diffrences between sample groups.

