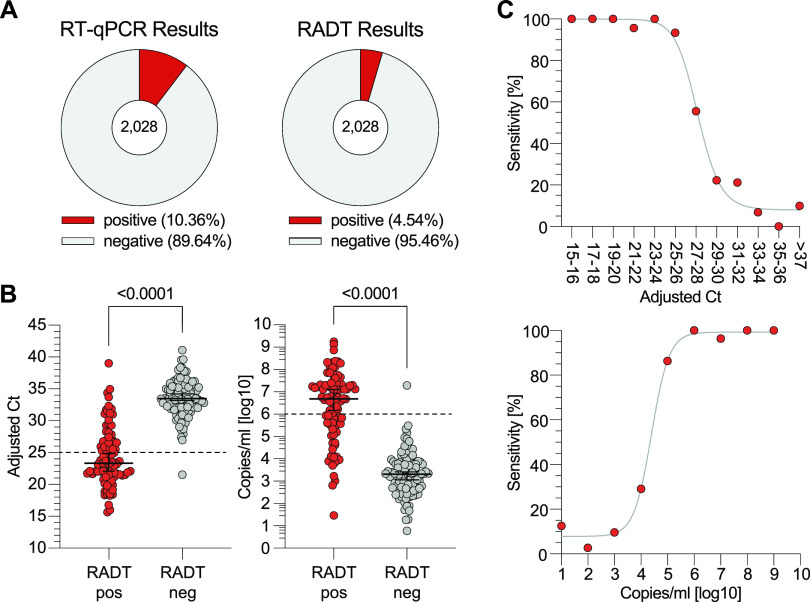
FIG 2.
Head-to-head comparison of SARS-CoV-2 detection by RT-qPCR and RADT. (A) RT-qPCR and RADT results of all 2,028 specimens. (B) The 210 RT-qPCR-positive samples are plotted by adjusted CT values and SARS-CoV-2 RNA load, respectively, and stratified by their RADT result (P < 0.0001, MWU). (C) The sensitivity of the RADT is stratified by adjusted CT values and RNA load in log copies/ml. The top graph shows data points for two CT units each. Due to low sample sizes, CT values of >37 were combined.

