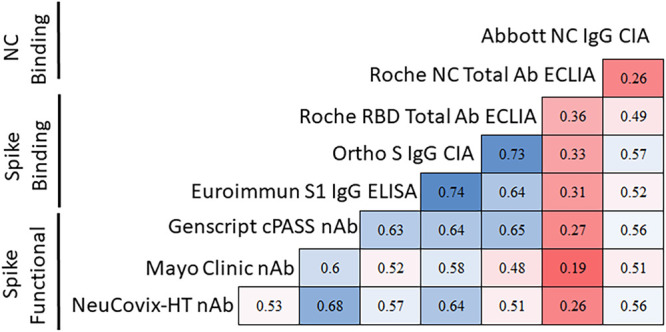
FIG 3.

SARS-CoV-2 antibody titer correlation across assays. The correlation of titers between different assays is shown in a matrix format using the Kendall rank correlation τp. Blue indicates a higher degree of correlation and red indicates a lower degree of correlation.
