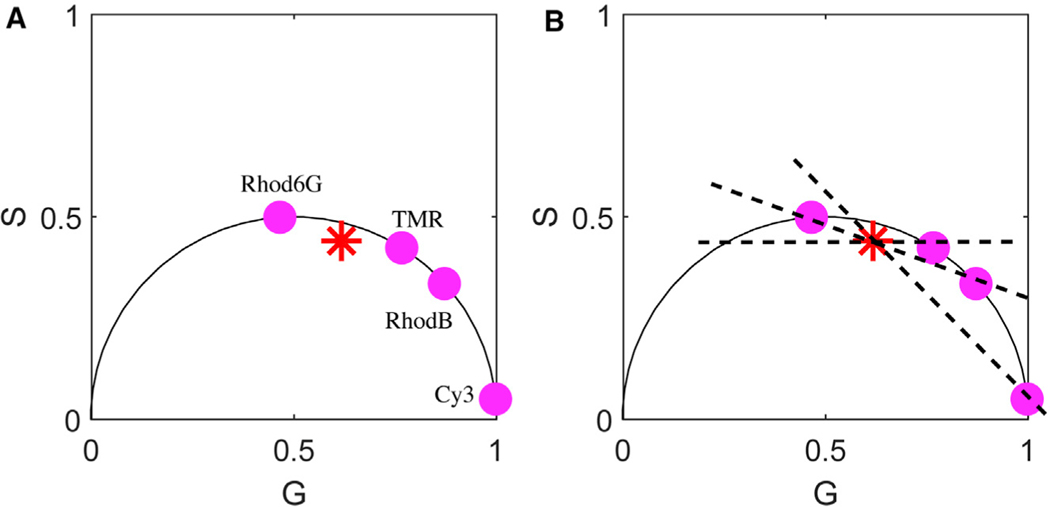
Figure 1. Phasor Analysis Provides the Lifetimes of Chemical Species but Not an Independent Measure of the Number of Chemical Species.
(A) is a typical phasor plot, as expected with a 4-component mixture. The red asterisk (Rhod-6G, TMR, RhodB, and Cy3) is subject to pulsed illumination. From this figure, it is not possible to discern the number of chemical species contributing to the phasor plot. What is more, as we can see in (B), if we assume 2 species, many choices of lifetimes could be warranted by the data as evidenced by the placement of the dashed diagonal lines. The point of intersection of these diagonal lines with the phasor plot’s hemisphere would be needed to deduce the lifetimes of a 2-component mixture if we had hypothesized this mixture to be composed of 2 species (as opposed to the correct number, 4). (B) superposes the phasor plots for each species measured independently. Their mixture is what yields the subfigure on the left, whose identity as a 4-component mixture is not apparent.

