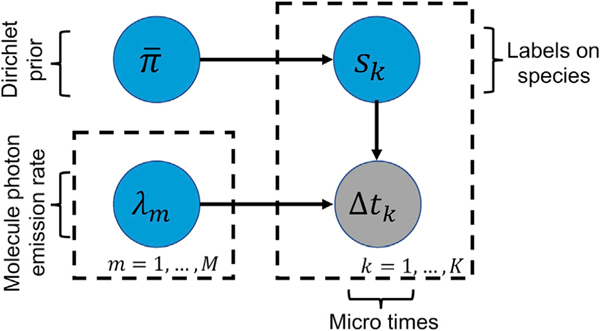
Figure 10. Graphical Representation of the Proposed Model.
A simple graphical representation of the model, where Δtk is the microtime k with k = 1, …, K. The inverse lifetime of species m is shown by λm, m = 1, …, M. The label sk tells us which of the species is contributing the kth photon. In the graphical model, the measured data are denoted by gray-shaded circles and the model variables, which require priors, are designated by blue circles. Each one of the labels has a prior, which is a Dirichlet probability .

