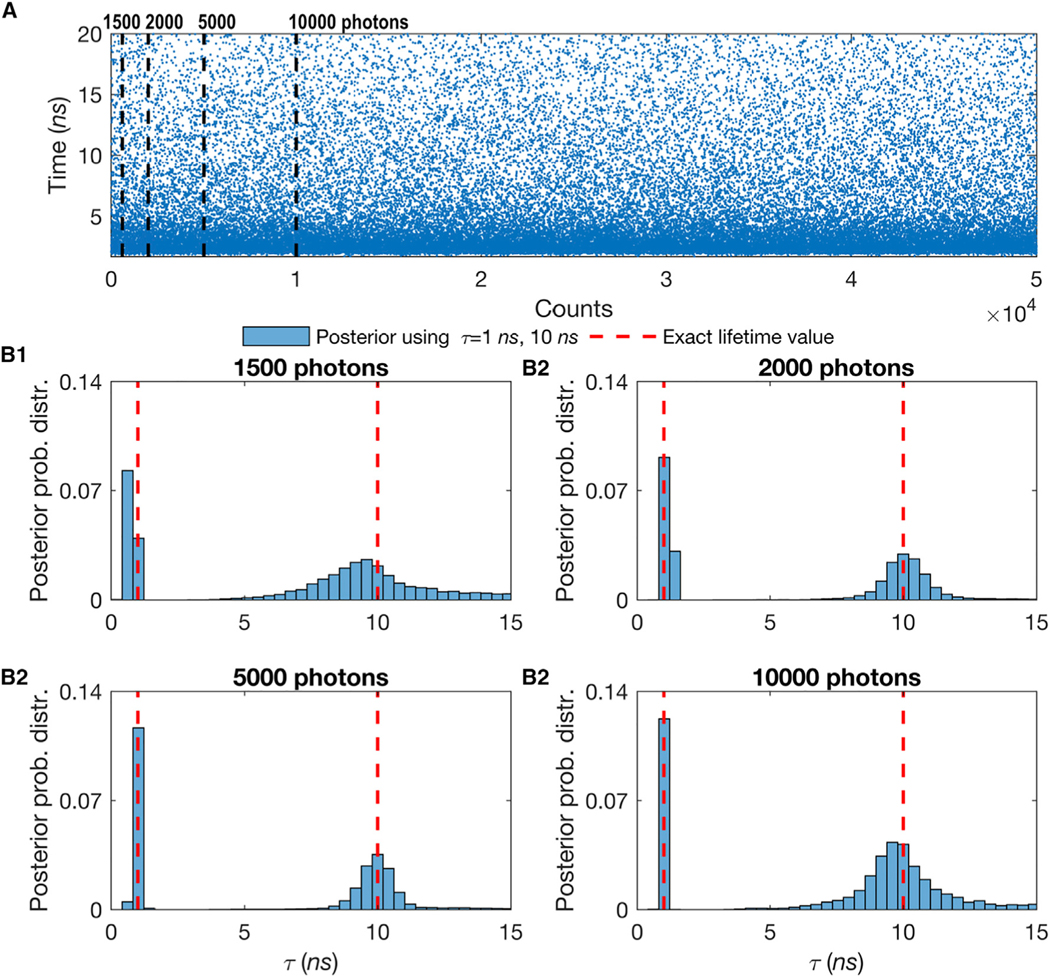
Figure 3. Effect of the Number of Detected Photons on 2 Simultaneous Molecular Lifetime Estimates Showing That the More Photons Collected, the Sharper the Lifetime Estimate for the Case of 2 Species.
(A) Here, we use mixtures of 2 species with different lifetimes, while all molecules are immobilized. The synthetic data are generated using τ = 1 ns for the first species and τ = 10 ns for the second with an equal ratio of molecules of each species (50%:50%). The blue dots represent single-photon arrival times detected after each excitation pulse.
(B) In the analysis to determine both lifetimes, we start with just 1,500 photons (first dashed line in A) (B1) and gradually increase the number of photons to 2,000 (B2), 5,000 (B3), and 10,000 (B4) photons. Here, all of the other features such as the frequency of acquisition and width of pulse are the same as in Figure S1. Also, we follow the same dashed red line convention as in Figure S1.
To see the results for more than two species see the Supplemental Experimental Procedures and Figures S5 and S6.

