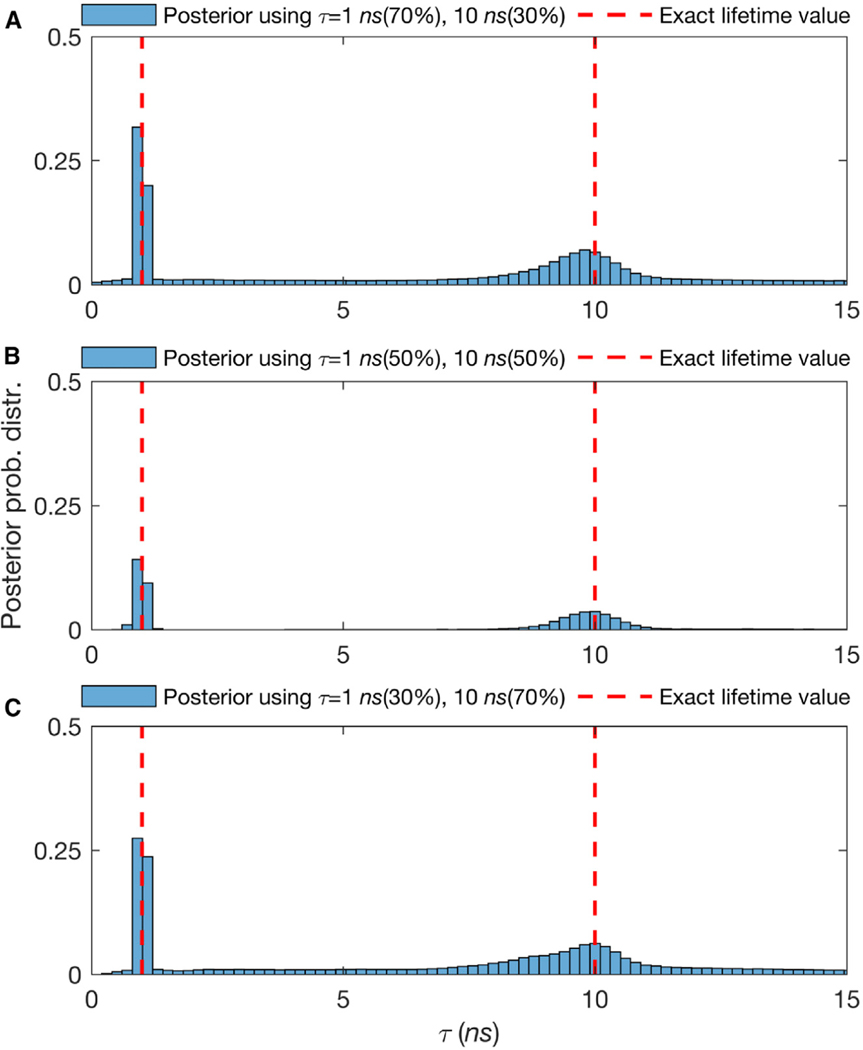
Figure 4. Effect of the Relative Fraction of Contributing Molecules from Different Species on Molecular Lifetime Estimates Showing That Higher Molecular Contributions Provide More Photons per Unit Time and Thus Sharper Lifetimes Estimates.
(A–C) The posterior probability distributions of traces with lifetimes of 1 and 10 ns, with 3,000 total photons and fraction of contributing molecules from different species of 70%–30%, 50%–50%, and 30%–70%, respectively. Here, all other features such as the frequency of acquisition and width of pulse are the same as in Figure S1. Also, we follow the same dashed red line convention as in Figure S1. For more details see the Supplemental Experimental Procedures and Figure S7.

