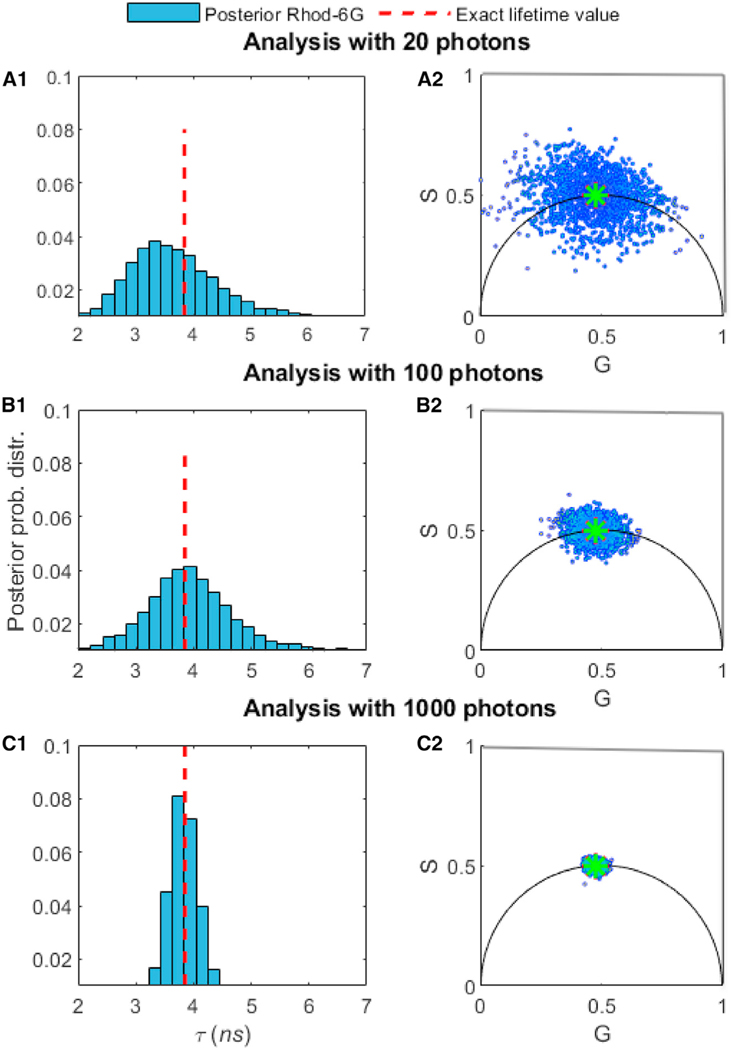
Figure 6. Comparison of the Number of Photons Needed to Assess the Lifetimes of Rhod-6G.
In (A1), we used 20 photons from experimental time trace Rhod-6G. For visualization purposes only, we show the corresponding phasor plots in (A2). In (B1) and (B2) and (C1) and (C2,) we repeated the analysis for 100 and then 1,000 photons. Using our method relying on BNPs, the estimated lifetimes are (A1) τ = 3.10 ns, (B1) τ = 3.95 ns, and (C1) τ = 3.91 ns. The excitation pulses occur at a frequency of 40 MHz and we assume a Gaussian shape with a standard deviation of 0.1 ns. The ground truth (dashed red lines) is obtained using TCSPC photon arrival histogram fitting when analyzing the whole time trace. In our BNP analysis, we do not pre-specify the number of species; we learn them alongside the associated lifetimes.

