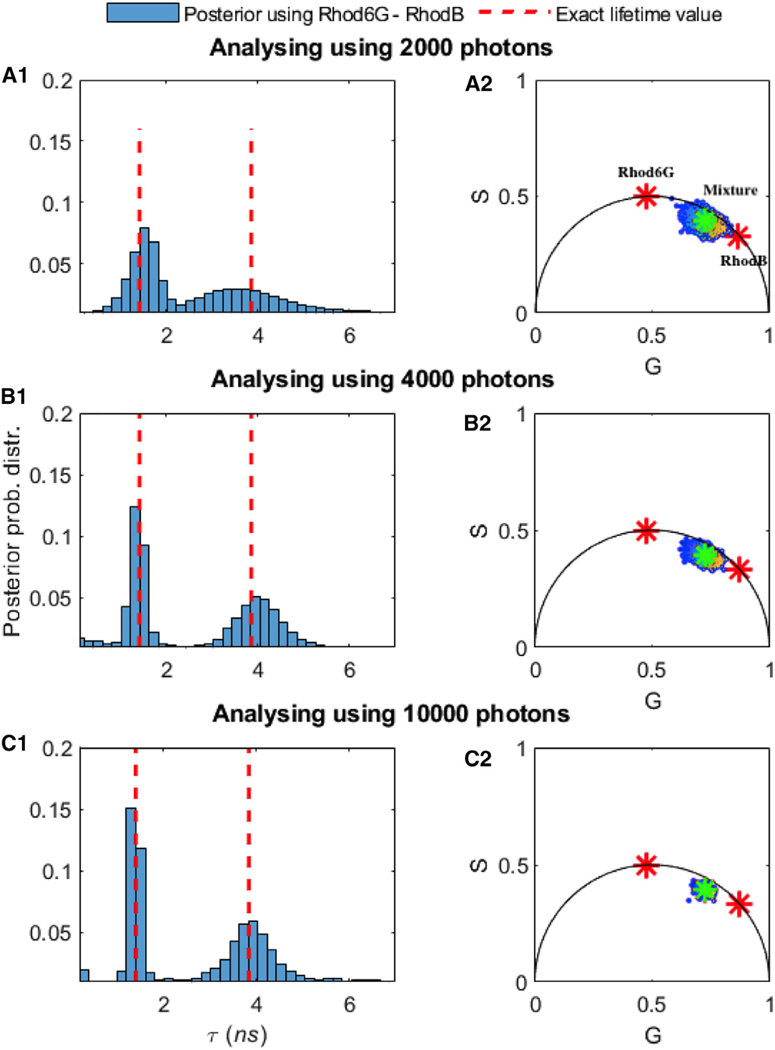
Figure 7. Comparison of the Number of Photons Needed to Assess the Lifetimes of Mixtures of Rhod-B and Rhod-6G.
In (A1) we used 2,000 photons. For visualization purposes only, we show the corresponding phasor plots in (B1). In (B1) and (B2) and (C1) and (C2,) we repeated the analysis for 4,000 and then 104 photons. Using BNPs, the estimated lifetimes are (A1) τ = 1.44–3.39 ns, (B1) τ = 1.42–3.96 ns, and (C1) τ = 1.41–3.90 ns. Here, all of the other features such as the ground truth (dashed red lines), frequency of acquisition, and so forth are the same as in Figure 6. The green star in (A2)–(C2) is the location of mixture of 2 species when we use whole trace, and the red asterisks show the location of the single species lifetime, for visualization purposes only, whose lifetimes we independently know from experiments on individual species.

