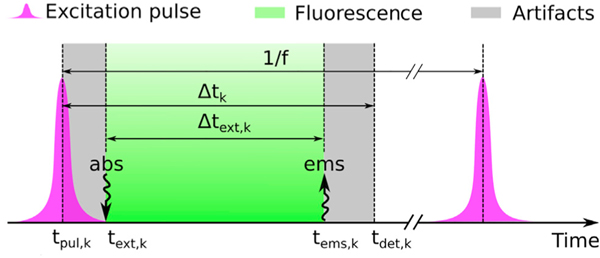
Figure 9. Factors That Contribute to the Recorded Photon Arrival Times.
Here, tpul.k is the time of the pulse’s peak. Since pulses last for some time, they may excite the molecules at slightly different times. As such, we denote with text.k the absorption time of the molecule triggering the kth detection. Moreover, we denote with tems.k the emission time of the photon triggering the kth detection. At last, on account of electronics limitations, the detection time, which we denote with tdet.k, may be different from tems.k. Here, the artifacts shown in gray originate from 2 sources: the left gray-shaded region is due to the width of the pulse, which leads to variation in the time of the molecular excitation, and the right gray-shaded region arises from the camera-dependent detection uncertainty. The time during which the fluorophore is excited (fluorescence lifetime) is shown in green. For more details, see also the Supplemental Experimental Procedures and Figure S12.

