Figure 3.
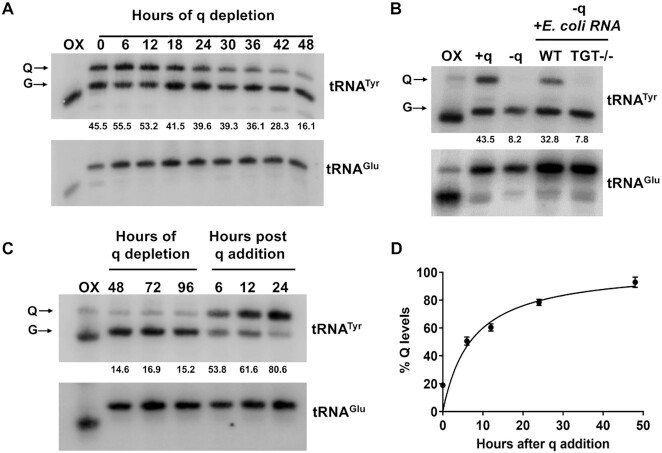
T. brucei cells obtain queuine from their environment. (A) APB gel—northern hybridization of total RNA isolated at indicated time points, from T. brucei cells depleted for queuine. (B) Northern blot of cells depleted for queuine (−q) and then fed with total RNA isolated from either WT or TGT−/− E. coli. +q lane indicates Q levels in cells prior to queuine depletion. (C) Time-course analysis of cells depleted for queuine and then fed with 20 nM synthetic queuine. All membranes were probed with a 32P radiolabeled probe against tRNATyr. tRNAGlu was used as a negative control (numbers under the blots indicate % Q levels). For panels A–C, oxidized RNA was used as a negative control (OX). (D) Densitometric analysis of percent of tRNATyr modified over time after addition of queuine, over three independent experiments.

