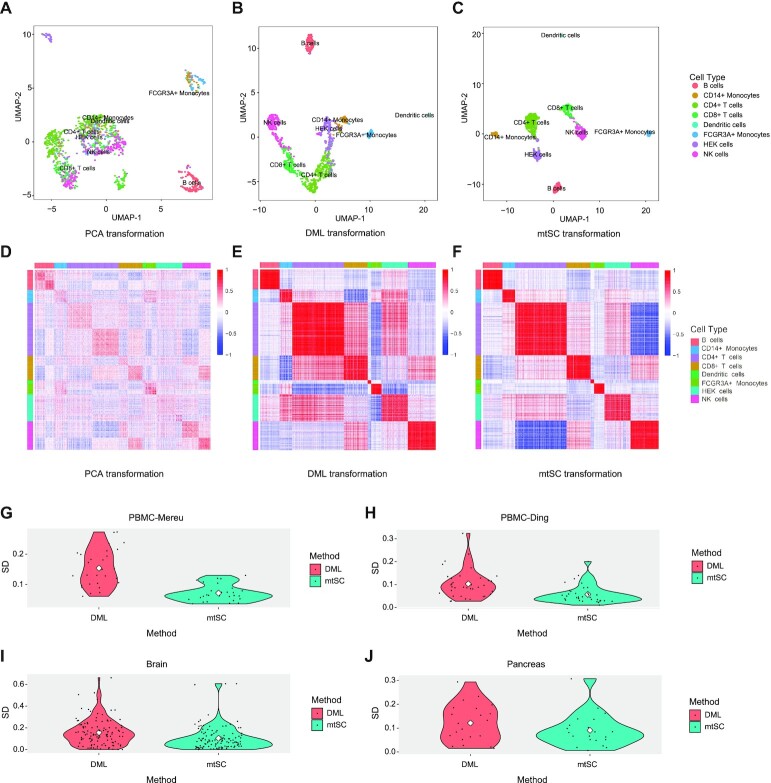
Figure 2.
Comparison of the transformations of PCA, DML and mtSC. (A) Visualization of the clustering results with UMAP after PCA transformation on the ‘Pbmc_chromium2’ dataset. (B) Visualization of clustering results with UMAP after DML transformation on the ‘Pbmc_chromium2’ dataset. (C) Visualization of the clustering results with UMAP after mtSC transformation on the Pbmc_chromium2 dataset. (D) Similarity heatmap calculated with the Pearson correlation coefficient after PCA transformation on the ‘Pbmc_chromium2’ dataset. (E) Similarity heatmap calculated with the Pearson correlation coefficient after DML transformation on the ‘Pbmc_chromium2’ dataset. (F) Similarity heatmap calculated with the Pearson correlation coefficient after mtSC transformation on the ‘Pbmc_chromium2’ dataset. (G) The comparison of the SD of similarity between any two cell types within ‘PBMC-Mereu’ transformed by DML and mtSC. The white diamond represents the mean value. SD stands for standard deviation. (H) The comparison of the SD of similarity between any two cell types within ‘PBMC-Ding’ transformed by DML and mtSC. (I) The comparison of SD of similarity between any two cell types within the brain transformed by DML and mtSC. (J) The comparison of SD of similarity between any two cell types within the pancreas transformed by DML and mtSC.

