Figure 3.

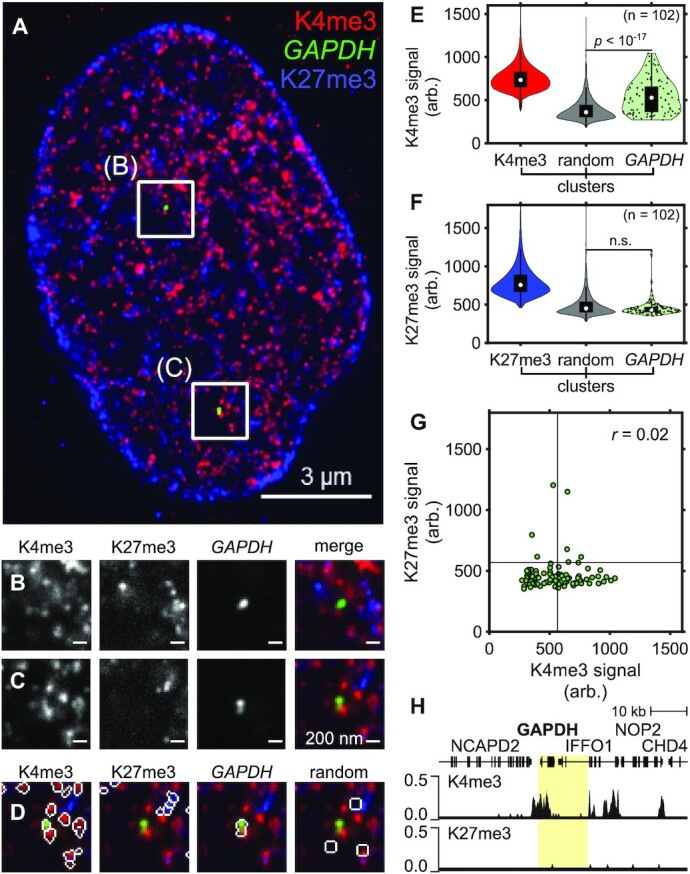
SCEPTRE distinguishes two histone marks at one genomic region. (A) An expanded RPE1 cell with immunolabeled H3K4me3 marks (K4me3, red) and H3K27me3 marks (K27me3, blue), and FISH-labeled GAPDH (green). (B, C) Zoomed in views of the approximate center plane of an image stack for each GAPDH allele in the cell seen in (A). (D) Outline of the segmented regions for H3K4me3, GAPDH, H3K27me3 and randomly selected region clusters for the image plane seen in (C). (E) Distribution of H3K4me3 fluorescence signal (arb. = arbitrary units) within H3K4me3, randomly selected regions (random) and GAPDH clusters. (F) Distribution of H3K27me3 fluorescence signal within H3K27me3, randomly selected regions and GAPDH clusters. (G) H3K27me3 and H3K4me3 fluorescence signals within GAPDH clusters (green). Black lines represent the threshold ‘on’ level for each fluorescence signal. The correlation coefficient (r) between fluorescence signals within GAPDH is shown in the top-right corner of the plot. (H) CUT&RUN normalized counts for H3K4me3 (top) and H3K27me3 (bottom) marks in RPE1 cells for the FISH-targeted GAPDH region (highlighted). Cluster numbers for (E). and (F). are K4me3 = 343334, K27me3 = 478825, random = 8322, GAPDH = 102. Significance determined by a right-tailed Wilcoxon rank-sum test of histone mark fluorescence signals in GAPDH against random cluster distributions. All scale bars are in pre-expansion units.
