Figure 4.
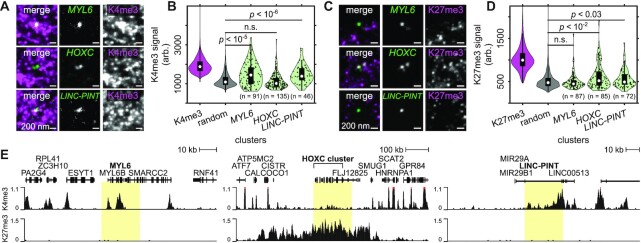
SCEPTRE quantifies one of two histone marks at three genomic regions. (A) Example images of the approximate center plane for each image stack of simultaneously FISH-labeled MYL6, HOXC or LINC-PINT loci (green) from the same expanded RPE1 cell immunolabeled for H3K4me3 marks (K4me3, magenta). (B) Distribution of H3K4me3 fluorescence signals (arb. = arbitrary units) within H3K4me3, randomly selected regions (random), MYL6, HOXC and LINC-PINT clusters (cluster numbers are K4me3 = 390331, random = 7421, MYL6 = 91, HOXC = 135, LINC-PINT = 46). (C) Example images of the approximate center plane for each image stack of simultaneously FISH-labeled MYL6, HOXC or LINC-PINT loci (green) from the same expanded RPE1 cell immunolabeled for H3K27me3 marks (K27me3, magenta). (D) Distribution of H3K27me3 fluorescence signals within H3K27me3, randomly selected regions, MYL6, HOXC and LINC-PINT clusters (cluster numbers are K27me3 = 196 798, random = 6041, MYL6 = 87, HOXC = 85, LINC-PINT = 72). (E) CUT&RUN normalized counts for H3K4me3 (top) or H3K27me3 (bottom) at the FISH-labeled MYL6, HOXC and LINC-PINT regions (highlighted). Significance determined by a right-tailed Wilcoxon rank-sum test of fluorescence signals in each FISH-labeled set against the random cluster distribution. All scale bars are in pre-expansion units.

