Figure 1.
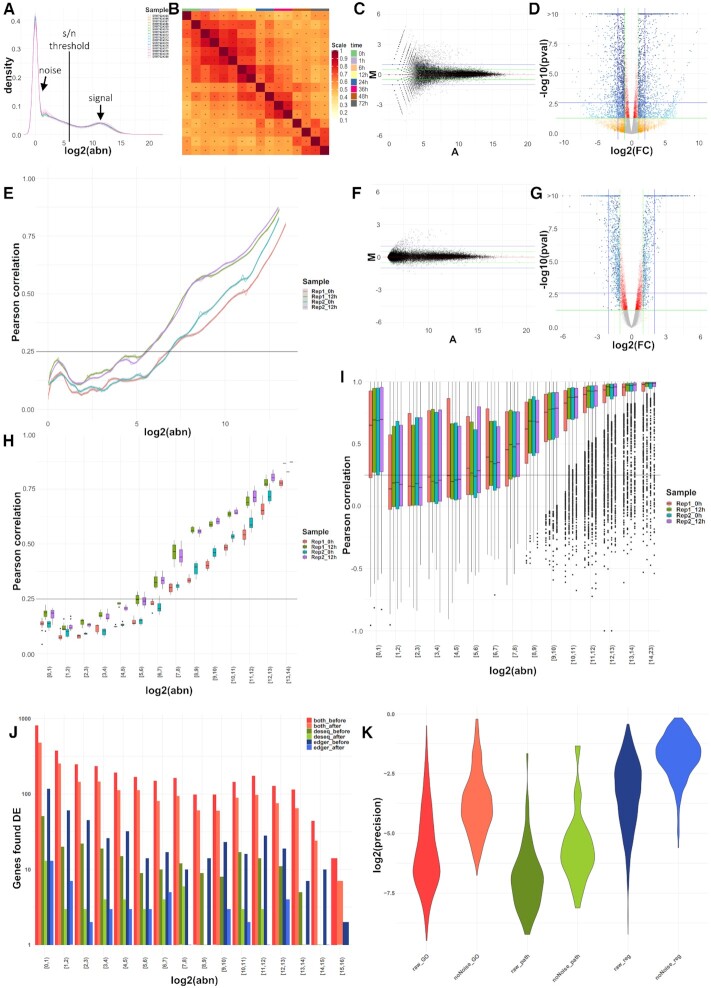
Overview of QC measures and original versus denoised outputs on standard components of an mRNA-seq pipeline. (A) Distributions of gene abundances by sample; the RHS distribution corresponds to the biological signal, the LHS distribution to the technical noise; the aim of noisyR is the identification of biologically meaningful values for the signal/noise threshold in between. (B) JSI on the 100 most abundant genes per sample; the replicates, and consecutive time points share a larger proportion of abundant genes. (C) MA plot of the raw abundances for the two 12h biological replicates; a larger proportion of low abundance genes exhibit high fold-changes, potentially biasing the DE calls. (D) Volcano plot of differentially expressed genes on the original, normalized count matrix; the colour gradient is proportional to the gene abundance. (E) Line plot of the PCC calculated on windows of increasing average abundance for the count matrix-based noise removal approach. (F) MA plot of the denoised abundances for the two 12 h biological replicates; the low-level variation is significantly reduced. (G) Volcano plot of differentially expressed genes on the denoised count matrix. (H) Box plot of the PCC binned by abundance for the count matrix-based noise removal approach. (I) Box plot of the PCC binned by abundance for the transcript-based noise removal approach. (J) Histogram of the differentially expressed genes found by applying DESeq and edgeR on the original and denoised count matrix respectively, binned by abundance; counts are on a log-scale for visualization. (K) Violin plot of the precision (intersection size divided by the query size) for the results of the enrichment analysis performed on the differentially expressed genes found for the original (raw) and denoised (noNoise) matrices (log-scale). In the Gene Ontology set (GO) the terms from Biological Process, Cellular Component and Molecular Function were grouped; in the Pathway set (path) the Kegg and Reactome terms were grouped; in the Regulatory terms (reg) the enriched Transcription Factors and microRNA entries were grouped.

