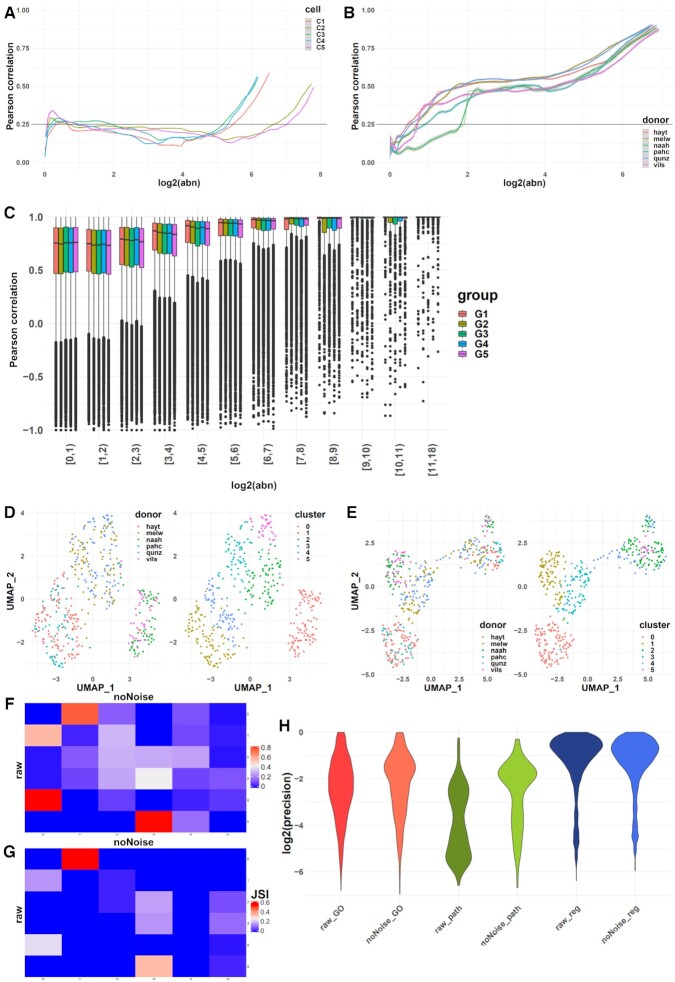
Figure 2.
Overview of noise filtering on smartSeq data and impact on biological interpretation of results. (A) PCC calculated on windows of increasing average abundance for the count-matrix based noise removal approach applied to the full count matrix of all cells (four cells shown). (B) PCC calculated on windows of increasing average abundance for the count-matrix based noise removal approach applied to the “pseudo-samples” formed by grouping all cells from each donor. (C) Box plot of the PCC binned by abundance for the transcript-based noise removal approach applied to five groups of five cells each obtained by concatenating the corresponding BAM files. (D) UMAP representation of the cells using the raw count matrix grouped by donor (left) and by inferred cluster (right). (E) UMAP representation of the cells using the denoised count matrix grouped by donor (left) and by inferred cluster (right) (F) Contingency matrix of the clusters formed before and after the noise removal; the shade of each tile represents the proportion of the cluster from the raw matrix (row) that belongs to the corresponding cluster of the denoised matrix (column). (G) Heatmap of the Jaccard similarity index between the 50 most significant markers identified for each cluster on the raw matrix (rows) and denoised matrix (columns). (H) Violin plot of the precision (intersection size divided by the query size) for the results of the enrichment analysis performed on the marker genes found for each cluster of the raw and denoised matrix respectively (log-scale).

