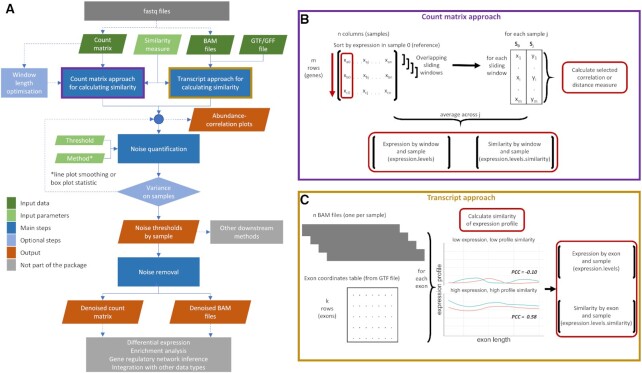
Figure 4.
Workflow diagram of the noisyR pipeline. (A) Workflow diagram describing the series of steps comprising the noisyR pipeline. Individual algorithms, finely tuned through hyper-parameters, are highlighted in blue. Optional steps are indicated through higher transparency. Common data pre- and post- processing steps not included in the package are indicated in grey. The steps for the count-matrix- and transcript- approaches are sketched in detail in subplots (B) and (C).

