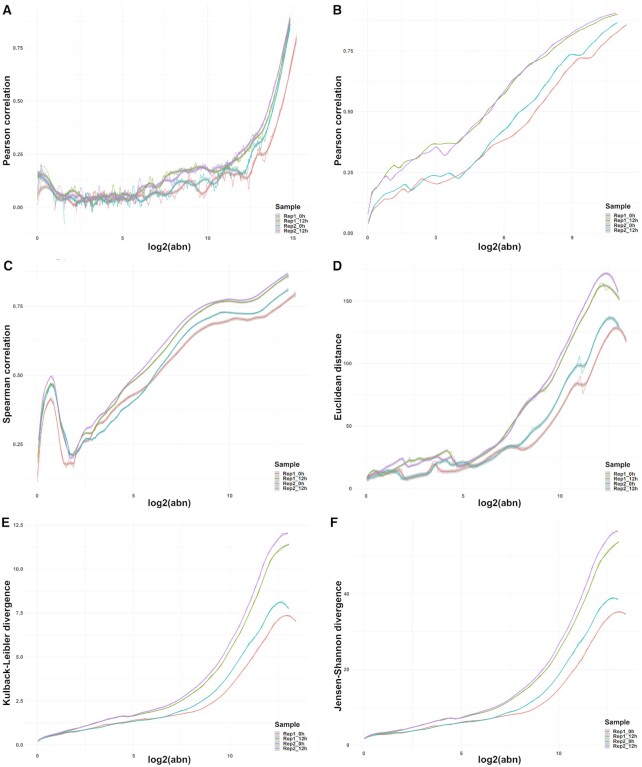
Figure 5.
Effects of hyperparameter selection on noise quantification. (A) PCC-abundance plot for a window length of 1,000 genes, ∼1/5th of the default. (B) PCC-abundance plot for a window length of 20 000 genes, ∼4 times the default. (C) Spearman correlation plotted against abundance for the default window length of ∼5500. (D) Inverse of the Euclidean distance plotted against abundance for the default window length of ∼5500. (E) Inverse of the Kulback–Leibler divergence plotted against abundance for the default window length of ∼5500. (F) Inverse of the Jensen-Shannon divergence plotted against abundance for the default window length of ∼5500.

