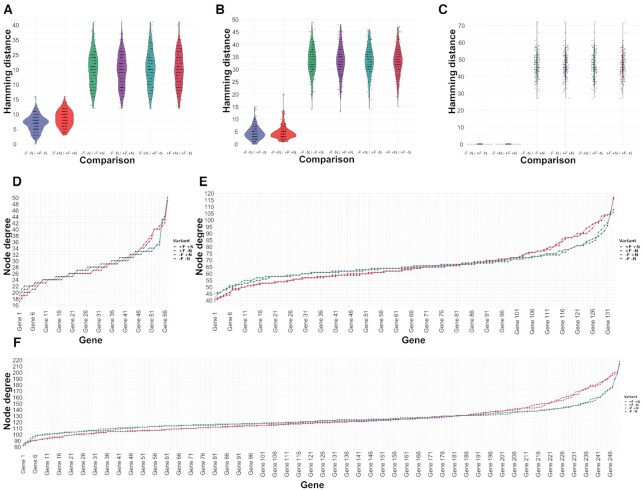
Figure 7.
Node degree distributions and pairwise Hamming distance distributions between combinations of original, noise-filtered, and normalized input smartSeq datasets. (A–C) Pairwise Hamming distance comparisons for each gene between all combinations of original (–F –N), noise-filtered (+F), and normalized (+N) input datasets using 133 genes associated with catalytic activity pathways from the smartSeq (Cuomo et al.) dataset (Methods) show a comparable pattern across different gene regulatory network inference tools: (A) GENIE3; (B) GRNBoost2; (C) PIDC. The results consistently show that across network inference tools noise-filtering has refining effects on the inferred network topologies in original or normalized data, further illustrating the advantages of noise-filtering to magnify biological signals by reducing technical noise. (D–F). For the smartSeq (Cuomoet al.) dataset the node degree distributions (total number of edges connected to a node/gene) of three sets of genes corresponding to different pathways are shown: (D) 57 genes associated with metabolism pathways; (E) 133 genes associated with catalytic activity pathways; (F) 246 genes associated with the cellular metabolic process. All four input data variants are shown: original (–F –N, purple); not noise-filtered but normalized (−F +N, green); noise-filtered but not normalized (+F –N, red); and noise-filtered and normalized (+F +N, blue) sorted by increasing values using –F –N as sorting key.

