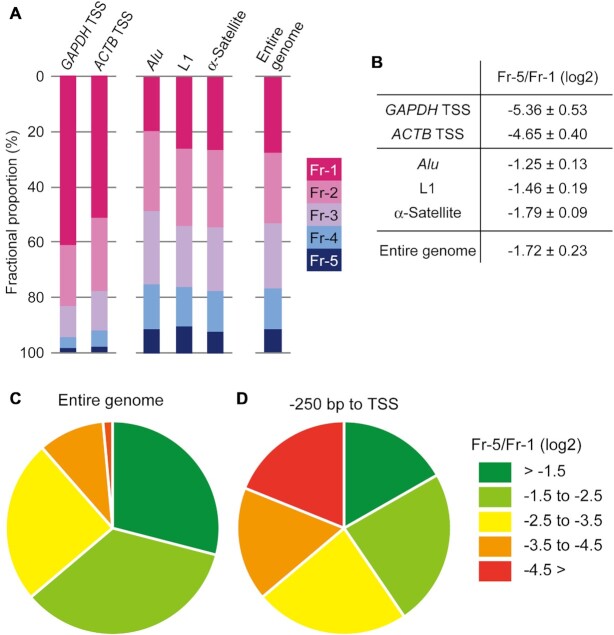
Figure 3.
The fractional proportions and the Fr-5/Fr-1 scores of the reference regions in the genome. (A) The TSSs of the GAPDH and ATCB genes were analyzed as active genomic regions. Alu, L1, and α-Satellite repeat sequences were analyzed as repressed genomic regions. The fractional proportions of the entire genomic DNA are also shown. (B) The ratio of the Fr-5 proportion to the Fr-1 proportion (designated as ‘Fr-5/Fr-1’) of the genomic regions referred to in (A) was calculated and represented as a log2 value (the mean ± SD). Data obtained from at least three independent experiments were utilized for the calculations. (C and D) Percentages of the degrees of local chromatin compaction in the entire genome (C) and in TSS regions (–250 bp to ±0 bp) (D). The compaction degrees were classified into five groups based on the Fr-5/Fr-1 scores, as shown in the key.

