Figure 5.
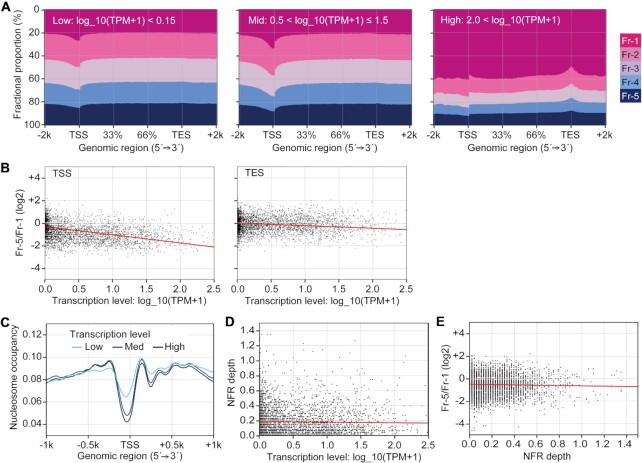
Genome-wide comparison between local chromatin compaction and transcription levels. (A) The fractional proportions from 2 kb upstream of the TSSs to 2 kb downstream of the TESs of active genes. The genes were divided into three groups based on their transcription levels (values of log10(TPM + 1)). (B) Scatter diagrams comparing the transcription levels and the Fr-5/Fr-1 scores at the TSSs or TESs of active genes. The red line in each panel represents an approximation line of the scatter points. The correlation coefficients (r) for TSS and TES are –0.4329 and –0.1703, respectively. Data for each gene are listed in Supplementary Table S4. (C) Nucleosome occupancy in the TSS regions (–1 kb to +1 kb) of active genes. The genes were divided to three groups as described in (A). (D) A scatter diagram comparing the transcription levels and NFR depth (the distance between the lowest and highest nucleosome levels within the TSS region (–250 bp to ±0 bp)). The red line represents the line of best fit for the scatter points. The correlation coefficient (r) is –0.0243. (E) A scatter diagram comparing NFR depth and Fr-5/Fr-1 scores. The red line represents the line of best fit for the scatter points. The correlation coefficient (r) is –0.0294.

