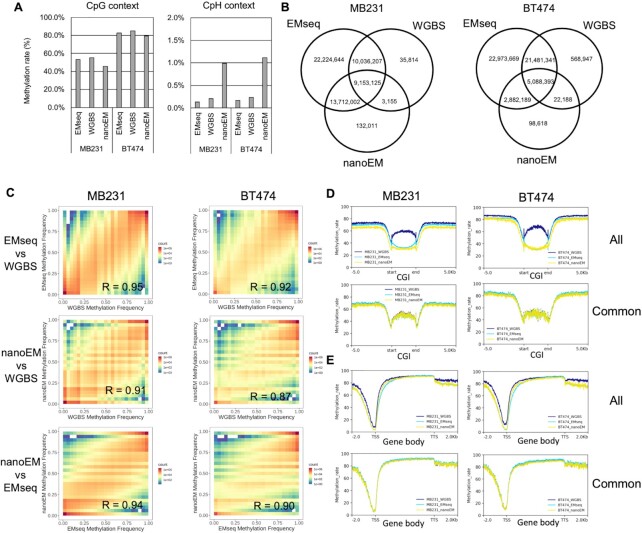
Figure 1.
Comparison among EMseq, WGBS, and nanoEM. (A) The average cytosine methylation rate by CpG and CpH contexts (H = A/C/T), which were measured by EMseq, WGBS, and nanoEM. Cytosines covered by at least five reads were used for calculation. (B) Venn diagrams of the CpG sites, regardless of their modification status, that were covered by at least five reads using EMseq, WGBS, and nanoEM. (C) The correlation of the methylation rate of CpG with EMseq, WGBS, and nanoEM. Pearson's correlations are shown in the graphs. (D, E) Average methylation rate of the CpG sites covered by at least five reads around CGIs and gene bodies of active transcribed genes expressed >10 transcript per million (TPM) using each method (top). Average methylation rate of CpG sites commonly covered in EMseq, WGBS, and nanoEM (bottom). The plots were prepared using deeptools v 3.4.2 (49). CGI and gene body were scaled to 3000 and 5000 bp by deeptools, respectively. The coordinates of CGI and transcript model of Gencode v33 were obtained from the University of California–Santa Cruz (UCSC) Table Browser (50) and the website of Gencode (51). The expression values per Gencode transcripts were obtained from the website of Cancer Cell Line Encyclopedia (CCLE; https://portals.broadinstitute.org/ccle) (27).

