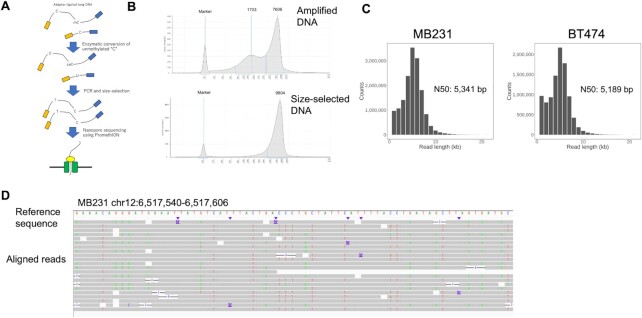
Figure 2.
Development of whole-genome nanoEM. (A) A schematic view of nanoEM. (B) Electropherograms of long amplicon of MB231 prepared by the Enzymatic Methyl-seq Kit and KOD Multi & Epi before and after size selection. Quantification was performed using a Genomic DNA Kit with 2200 TapeStation. (C) Sequence length distributions of nanoEM of 1D pass reads. N50 length of each datasets were shown in graphs. (D) The 1D pass reads of nanoEM on MB231 were aligned to the reference human genome using minimap2 (23). Base mismatch is shown for each read. The reads are shown in the Integrative Genomics Viewer (IGV) (52).

