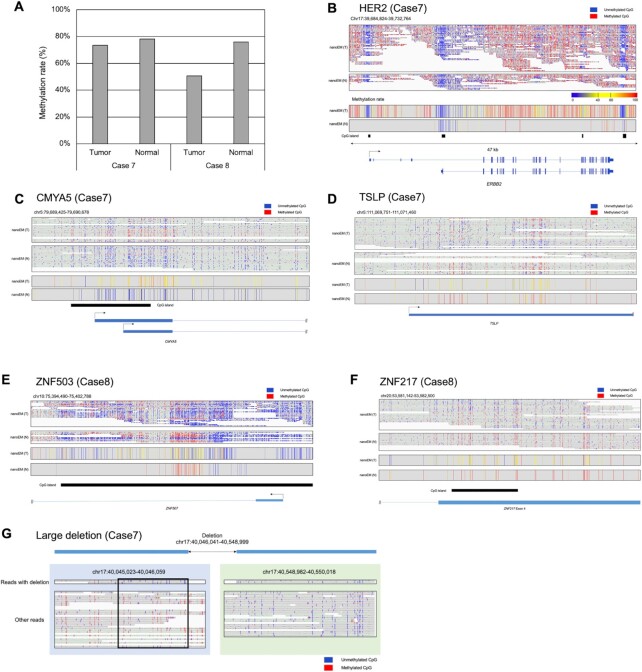
Figure 5.
Applications to clinical samples. (A) The average cytosine methylation rate by CpG, measured by nanoEM. Cytosines covered by at least five reads were used for the calculation. (B–F) Examples of DMRs between tumor and normal tissues of Case 7 (B and C) and Case 8 (D and F). nanoEM reads of tumor and normal tissues aligned to each region are shown in the top panel. The location of transcript models and CGIs is shown in the bottom panel. Average methylation rate of CpG covered by at least five reads is shown in the middle panel. (G) Methylation patterns detected by nanoEM visualized using the IGV (52). Reads with and without deletion are shown separately. The unmethylated region specific to reads with deletion is shown in the box.

