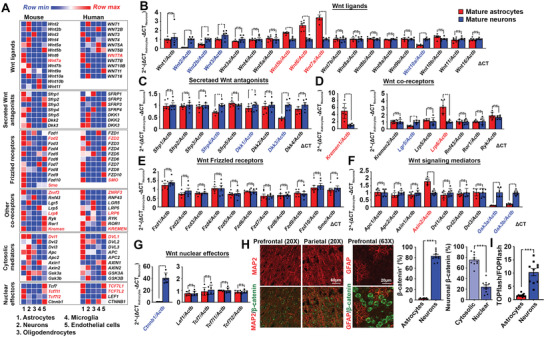
Figure 1.

Wnt signaling network in the brain. A) Referencing the Brain RNA‐Seq portal, normalized fragments per kilobase million (FPKM) values of Wnt signaling components in both human and mouse mature brain cells are compared. Red highlights are genes commonly enriched in both human and mouse astrocytes. B–G) Quantitative PCR analyses of various categories of Wnt signaling components from messages harvested from mouse primary neurons and astrocytes. The expression of genes of interests is normalized against expression level of beta‐actin. Relative fold changes between astrocytes and neurons are calculated (N = 6, ***p <0.0001, **p <0.001, *p <0.01, ns = non‐significant, two‐tailed unpaired t‐test). Red highlights are genes significantly enriched in astrocytes whereas blue ones are those significantly enriched in neurons. H) Representative immunostaining images of β‐catenin signals in MAP‐positive neurons or GFAP‐positive astrocytes in the cortex regions. Quantification of relative proportion of β‐catenin‐positive cells types (N = 10, ***p <0.0001, unpaired t‐test); and the relative proportion of cytosolic versus nuclear β‐catenin signals in neurons are shown (N = 10, ***p <0.0001, two‐tailed unpaired t‐test). I) Nuclear β‐catenin activities in Wnt‐ligand exposed DIV14 primary neurons and cultured astrocytes (N = 10, ***p <0.0001, ns = non‐significant, two‐tailed unpaired t‐test). Values represent the Mean ± SEM.
