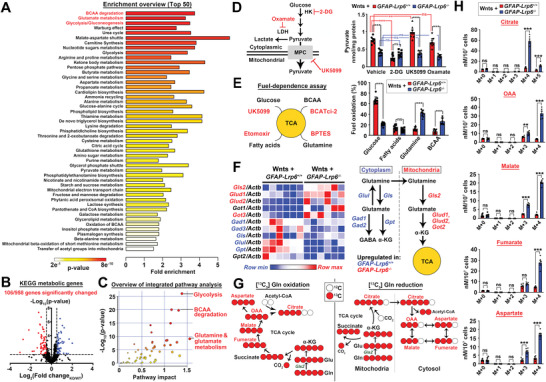
Figure 2.

LRP6 shapes the metabolic landscape in astrocytes. A) Global metabolic profiling of freshly enriched GFAP‐Lrp6+/+ and GFAP‐Lrp6–/– astrocytes followed by the Metabolite Set Enrichment Analysis (MESA) (N = 6). Pathways are ranked by significance values. B) qPCR analyses of 958 mouse KEGG metabolic‐related genes expression in freshly enriched GFAP‐Lrp6+/+ and GFAP‐Lrp6–/– astrocytes (N = 6; horizontal dotted line p = 0.05; two‐tailed unpaired t‐test). C) Integrated metabolites and gene expression analyses were performed on MetaboAnalyst. Top three significant pathways with the greatest impact are labelled. D) Levels of intracellular pyruvate was evaluated in Wnt ligands (Wnt3a, 5a, 6, and 7a recombinant proteins; 100 ng mL−1 each) exposed cultured astrocytes after pharmacological inhibition against glucose utilization (50 mm 2‐deoxyglucose [2‐DG]); pyruvate entrance into mitochondria (2 µm UK5099) or lactate conversion (2.5 mm oxamate) for 4 h (N = 8, ***p <0.0001, **p <0.001, ns = non‐significant, One‐way ANOVA). E) Seahorse Mito Fuel Flex test on evaluating fuel dependent was performed with slight modification to include an inhibitor against BCAA catabolism (5 µm BCATci‐2) (N = 10, ***p <0.0001, ns = non‐significant; two‐tailed unpaired t‐test). F) Expression levels of genes in charge of both cytosolic (blue) and mitochondrial (red) glutaminolysis were analyzed in cultured astrocytes. All genes of interests are normalized against Actb internal control (N = 6). G) Schematic representation of oxidative and reductive reactions in glutamine‐glutamate‐α‐ketoglutarate flux. H) Mass isotopologue analysis of citrate; oxaloacetate (OAA); malate; fumarate; and aspartate in GFAP‐Lrp6+/+ and GFAP‐Lrp6–/– cultured astrocytes exposed to [U‐13C]‐glutamine for 2 h (N = 5, ***p <0.0001, **p <0.001, ns = non‐significant, two‐tailed unpaired t‐test). Values represent the Mean ± SEM.
