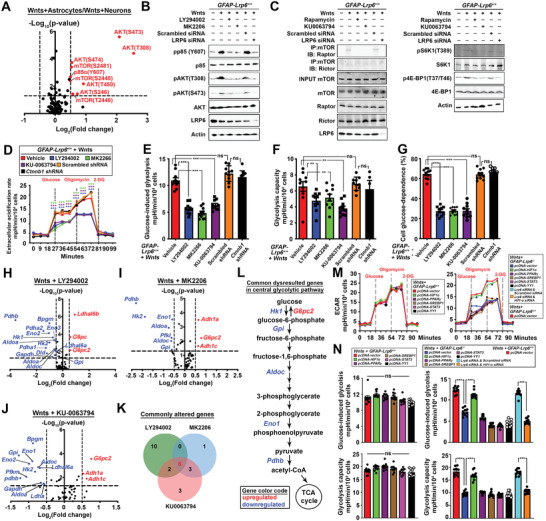
Figure 3.

LRP6‐mediated Wnt signaling models the metabolic network in astrocytes. A) Normalized signal intensities of phosphorylated and total forms of each protein were determined, the ratio (phospho/total) of each protein was calculated between cultured astrocytes and neurons exposed to Wnt ligands. Dotted line indicates p = 0.05. Red highlights are genes significantly enriched in astrocytes whereas blue ones are those significantly enriched in neurons (N = 6, two‐tailed unpaired t‐test). B,C) Representative Western blots of cultured GFAP‐Lrp6+/+ astrocytes subjected to pharmacological inhibition against PI3K (10 µm LY294002), AKT (1 nm MK2206), mTOR (0.1 nm rapamycin/ 10 nm KU‐0063794) for 24 h; or having Lrp6 acutely knockdown for 72 h prior harvesting. Quantifications are shown in y Figure S4A,B, Supporting Information. D) ECAR profile, E) glucose‐induced glycolysis, F) glycolysis capacities and glucose dependence of Wnt ligands exposed cultured GFAP‐Lrp6+/+ astrocytes pre‐treated with 10 µm LY294002, 1 nm MK2206, 10 nm KU‐0063794 for 24 h; or having Ctnnb1 knockdown for 72 h were analyzed (N = 10, ***p <0.0001; **p <0.01; One‐way ANOVA). H–J) Comparisons of 60 glycolysis pathway gene expression levels in Wnt ligands‐treated cultured GFAP‐Lrp6+/+ astrocytes exposed to 10 µm LY294002, 1 nm MK2206, or 10 nm KU0063794 for 24 h. Comparisons were made against corresponding vehicle treatment controls (N = 6‐9; dotted line p = 0.05; two‐tailed unpaired t‐test). K) Venn diagram showing the number of commonly altered genes identified from Figure 3H–J; L) 6 out of 10 commonly altered genes were mapped to the central glycolysis pathway. Red highlights are genes commonly upregulated whereas blue highlights are those commonly downregulated. M) Glycolytic functions of Wnt ligand‐exposed GFAP‐Lrp6+/+ and GFAP‐Lrp6–/– astrocyte cultures ectopically expressing (72 h) various known downstream modulators of mTOR were evaluated (N = 10, ***p <0.0001; two‐tailed unpaired t‐test at corresponding time points). N) Glucose‐induced and maximal glycolytic capacities were calculated from data in Figure 3M (N = 10, ***p <0.01; one‐way ANOVA). Values represent the Mean ± SEM.
