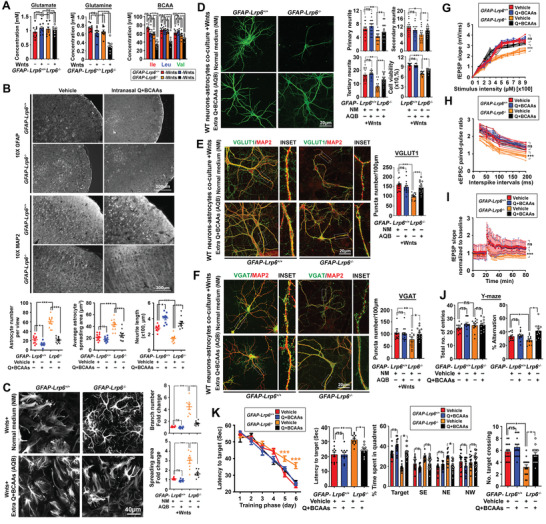
Figure 6.

Glutamine and BCAAs supplementation improve neurite integrity; synaptic abundance; cognitive and memory function in GFAP‐Lrp6−/− mice. A) Extracellular levels of glutamate (left) and glutamine (middle) were measured by colorimetric assays in Wnts‐treated primary astrocyte cultures. Intracellular BCAAs were also determined by GC‐MS (N = 9, ***p <0.0001; ns = non‐significant; One‐way ANOVA). B) Representative images of GFAP‐positive astrocytes and MAP2‐positive dendrites at the frontal cortex region of GFAP‐Lrp6+/+ and GFAP‐Lrp6−/− mice administered with a small bolus (≈15–20 µl) of 560 nmol/0.4 g average brain wet weight of glutamine and a mixture of BCAAs (each 10 nmol/0.4 g average brain wet weight) or equal volume of vehicle for 30 days (N = 6). C) Representative images GFAP‐positive astrocytes in Wnts‐exposed cultured astrocytes supplemented with routine culture medium or ones with additional supplementation of glutamine (Q) (340 µm) and BCAAs (Ile: 40 mm, Leu: 20 mm, and Val: 20 mm) (Q+BCAAs). Quantification of branching number and spreading area are shown on the right (N = 8, ***p <0.0001; ns = non‐significant; One‐way ANOVA). D) Representative images of MAP2‐positive neurites in wildtype mouse primary neurons co‐cultured with Wnts‐exposed mouse astrocytes in the routine culture medium or in one with extra supplementation of glutamine (Q) (340 µm) and BCAAs (Ile: 40 mm, Leu: 20 mm, and Val: 20 mm). Quantification of primary; secondary, and tertiary neurites and viability of neurons are shown (N = 16, ***p <0.0001, **p <0.001, *p <0.01, One‐way ANOVA). E,F) Representative images of E) VGLUT1/MAP2 and F) VGAT/MAP2 staining in wildtype neurons co‐cultured with Wnts‐treated GFAP‐Lrp6–/– astrocytes in the setting similar to (D). Quantification of puncta density are shown on the right (N = 15, ***p <0.0001, ns = non‐significant, One‐way ANOVA). G–I) Electrophysiology recordings in acute brain slices harvested from mice supplemented with vehicles or glutamine plus BCAA in manners mentioned in (B). G) fEPSP input‐output relationship was recorded in the hippocampal CA1 region upon stimulation at the superior colliculus region (n = 6, ***p <0.0001; ns = non‐significant, Two‐way ANOVA). H) Whole‐cell eEPSC pair‐pulsed ratio pattern recorded in hippocampal CA1 pyramidal neurons (n = 6, ***p <0.0001, ns = non‐significant; Two‐way ANOVA). I) Long‐term potential recording in superior colliculus after induction of a train of 100‐Hz stimuli. (N = 6, *p <0.01, ns = non‐significant; Two‐way ANOVA). J) Total entries and percentage alternations in a Y‐maze paradigm (N = 12, *p <0.01, ns = non‐significant, One‐way ANOVA). K) Escape latency during the training phase (N = 12, ***p <0.0001, Two‐way ANOVA) and probe trial (N = 12, **p <0.001, *p <0.01, ns = non‐significant, One‐way ANOVA); percentage of time spent in various quadrants (N = 15, *p <0.01, ns = non‐significant, One‐way ANOVA) and number of target crossing (N = 15, *p <0.01, ns = non‐significant, One‐way ANOVA) of Morris water maze (MWM) test. Values represent the Mean ± SEM.
