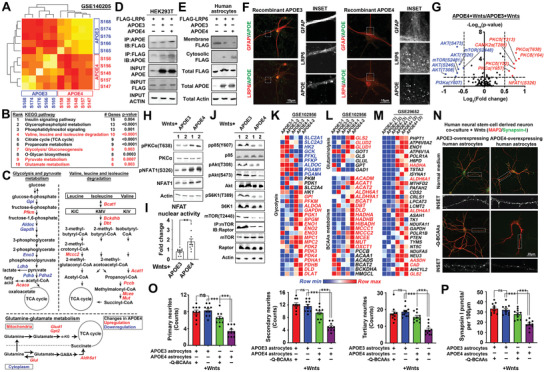
Figure 7.

APOE4 interacts with and reduces LRP6 surface abundances; alters Wnt‐governed metabolic network in human astrocytes. A) Heatmap showing the similarity and differences among transcriptome profiles of APOE3 and APOE4 mouse hippocampal samples from the GSE140205 dataset. B) Differential gene expression analyses of 958 KEGG metabolic‐related genes between APOE3 and APOE4 groups. All significantly changed (FDR <0.05) genes were enriched and subjected to GSEA analysis. Top ten enriched KEGG pathways are listed. Red highlights indicate relevant metabolic‐related pathways. C) Significantly altered genes found in the APOE4 group which were involved in “glycolysis and pyruvate metabolism;” “valine, leucine and isoleucine degradation” and “glutamine‐glutamate metabolism” were laid out. Red highlights indicate upregulated genes and blue ones are downregulated. D,E) Representative immunoblots revealing D) stronger interactions between LRP6 and APOE4 over that with APOE3 performed in HEK293T cells (N = 6); and E) reduced surface availability of LRP6 when APOE4 was ectopically expressed in wildtype human astrocytes (N = 6). F) Representative images showing the cellular distribution of LRP6 along with exogenous recombinant APOE3 or APOE4 proteins in wildtype human astrocytes (N = 10). G) Normalized intensities of phosphorylated and total forms of each protein were determined. Ratio (phospho/total) of each protein was calculated between Wnts‐treated APOE4‐and APOE3‐overexpressing human astrocytes. Horizontal dotted line indicates p = 0.05 (N = 6, two tailed unpaired t‐test). H) Representative immunoblots of PKCα‐NFAT1 signaling components (N = 6) and I) and luciferase assay for NFAT1 nuclear activities (N = 9, **p <0.001, two‐tailed unpaired t‐test) in Wnts‐treated human astrocytes ectopically expressing either APOE3 or APOE4. J) Representative immunoblots revealed loss of activating phosphorylation on PI3K‐AKT‐mTOR signaling components in Wnts‐treated human astrocytes ectopically expressing APOE4 (N = 6). K,L) Referencing the transcriptome data of isogenic APOE3 and APOE4 human iPSC‐derived astrocytes (GSE102956); key genes involved in K) glycolysis; L) glutaminolysis and BCAA metabolism were dysregulated. Red indicates upregulated genes and blue ones are downregulated. M) Comparing the transcriptome data of APOE3 and APOE4 astrocytes harvested from human LOAD brains of Braak stages I‐II (GSE29652); significantly changes genes that are also NFATC1 targets with roles in fuel metabolic pathways were enriched. Red highlights are ones indicated in glutamine and BCAA metabolism. N) Representative images showing neuritic morphology and pre‐synaptic puncta density in human neural stem‐cell derived neurons co‐cultured with Wnts‐treated APOE3 or APOE4‐overexpressing human astrocytes in the normal culturing medium or in one without any glutamine and BCAAs supplementation (‐Q‐BCAAs) (N = 10). O) Quantification of primary, secondary, and tertiary neurites together with P) Synapsin‐I puncta density are shown (N = 10, ***p <0.0001, ns = non‐significant, One‐way ANOVA). Values represent the Mean ± SEM.
