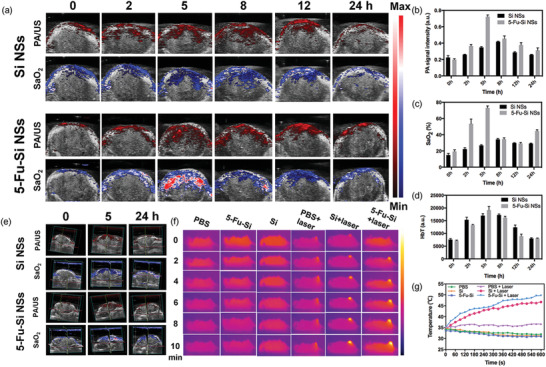
Figure 4.

a) In vivo PA imaging in the tumors at different time points after i.v. injection of Si NSs and 5‐Fu‐Si NSs. b) PA intensity of tumors at different time points. c) SaO2 intensity of tumors at different time points. d) HbT signal intensity of tumors at different time points. e) In vivo 3D reconstruction PA imaging in the tumors at different time points of Si NSs and 5‐Fu‐Si NSs. f) Thermal images of U87‐MG tumor‐bearing mice in different groups under 808 nm laser irradiation (1.5 W cm−2). g) Quantitative analysis of temperature changes in tumor area at different time‐points.
