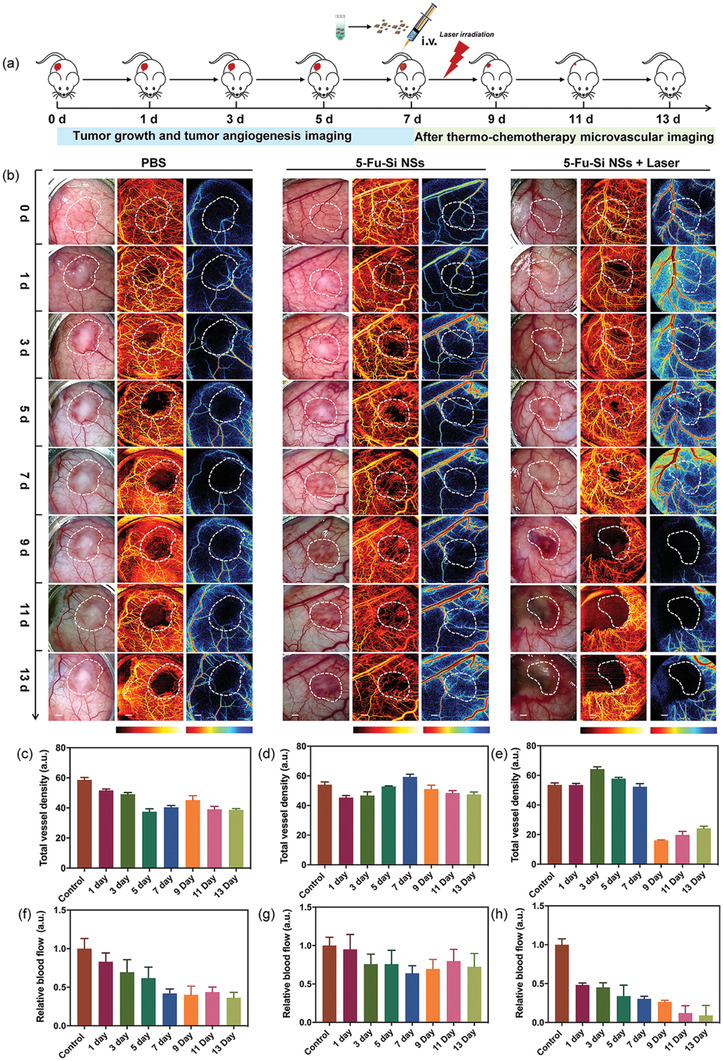
Figure 5.

a) Schematic diagram of the model, treatment, and monitoring regime used in mice with 5‐Fu‐Si NSs. b) Representative white light, OCTA, and LS images at different time‐points for each group. The white dotted line represents the tumor area and the ROI area. c) Quantified total vessel density with PBS treatment. d) Quantified total vessel density with Si NSs treatment. e) Quantified total vessel density with 5‐Fu‐Si NSs plus laser irradiation treatment. f) Quantified RBF with PBS treatment. g) Quantified RBF with Si NSs treatment. h) Quantified RBF with 5‐Fu‐Si NSs plus laser irradiation treatment. Scale bar: 2 mm.
