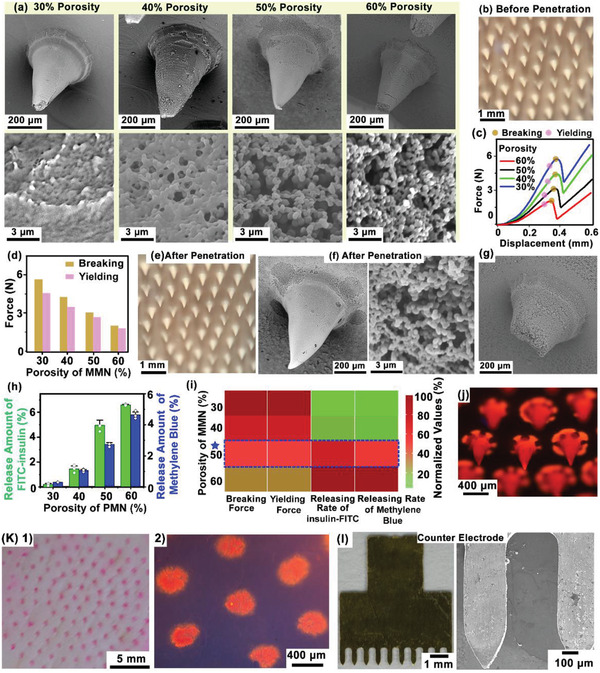
Figure 2.

Characterizations of MMN. a) The SEM images showing a series of MMN with different porosities (30–60%). b) Digital photograph showing the morphology of MMN patch. c) The stress–strain test of MMN by dynamometer. The critical breaking and yielding forces were labeled, respectively. d) Quantitative analysis of the critical breaking and yielding forces of MMN with different porosities. e,f) Optical and SEM images showing MMN with 50% porosity could remain intact after insertion into skin. g) SEM image showing mechanical failure of MMN with 60% porosity after insertion into skin. h) Quantification of the molecular (methylene blue and insulin‐FITC) diffusion rates across the interface of MMNs with different porosities. N = 3 measurements. i) Heatmap plot summarizing the behaviors of the tested mechanical failure forces (yielding and breaking) and the diffusion rates (methylene blue and insulin‐FITC) at different MN porosities. j) Fluorescence images of MMN stained with Rhodamine B. k) Photograph and fluorescence image showing Rhodamine B deposition into pigskin by MMN penetration. l) Optical photograph and SEM images of MN C.E.
