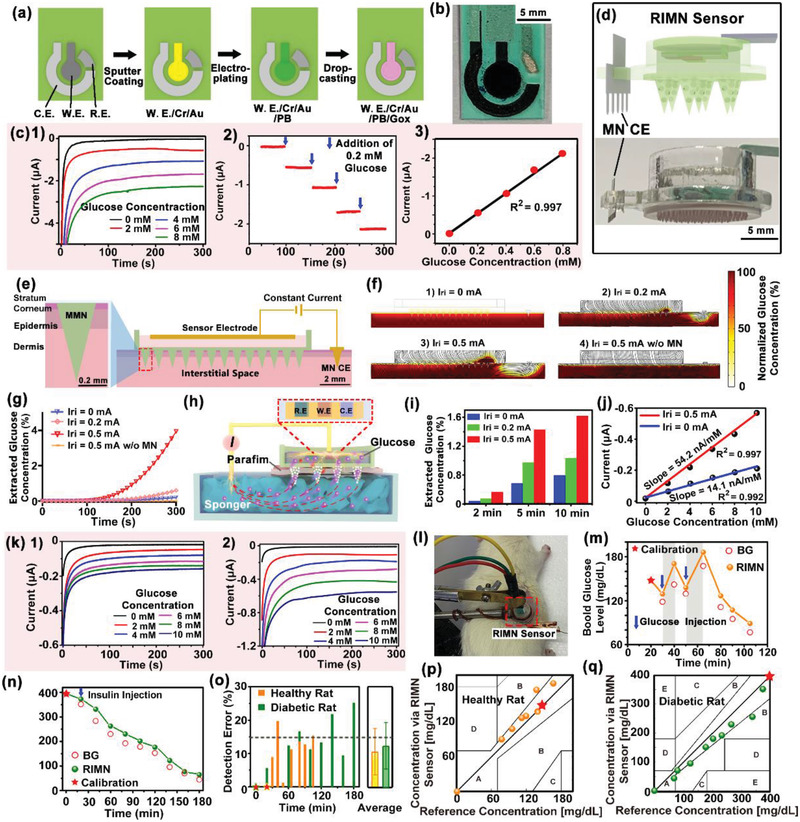
Figure 3.

Performance characterization of the RIMN sensor. a) Illustration of the fabrication procedure and b) the optical image of planar glucose electrode. c) The amperometric response of planar glucose electrode. 1) The electrode was tested with a series of glucose solution (0–0.8 mm). 2) Glucose concentration stepwise‐increased by 0.2 mm (blue arrows). 3) The linear relations of the current signals and the corresponding glucose concentrations. d) Schematic diagram (top) and optical image (bottom) of the RIMN sensor. e) COMSOL 2D model of glucose extraction by RIMN. f) The electrical field distribution (indicated with black curves) and glucose concentration profile (indicated with brown color) at t = 300 s after reverse iontophoresis. g) Concentration–time relations of subcutaneous glucose extraction were quantitatively analyzed. h) Schematic showing the experimental setup of RIMN sensor for glucose sensing in vitro. i) Quantification of glucose extraction efficiency under different iontophoretic currents and time conditions. j) The linear relations of the current signals and glucose concentrations via RIMN sensors. k) The amperometric responses of RIMN sensor upon different glucose concentrations under 0 and 0.5 mA reverse iontophoretic extraction for 5 min. l) Photograph showing the application of RIMN sensor on anesthetized rat. m,n) The dynamic glucose signals recorded by RIMN sensors on m) healthy rat and n) diabetic rat model. The detected current signal via RIMN was converted to glucose concentration and the actual BG were measured via standard glucose test strips. The asterisk indicated the calibration point. The blue arrow indicated the time point of glucose or insulin injections. o) Statistical analysis showing the detection errors of RIMN sensor compared to the actual BG at corresponding time points. The asterisks indicated calibration points. The dash line indicated the clinical criterion of error <15%. p,q) Clarke's error grid analysis showing the detection accuracy of RIMN sensor compared to the actual BG. The asterisks indicated calibration points.
