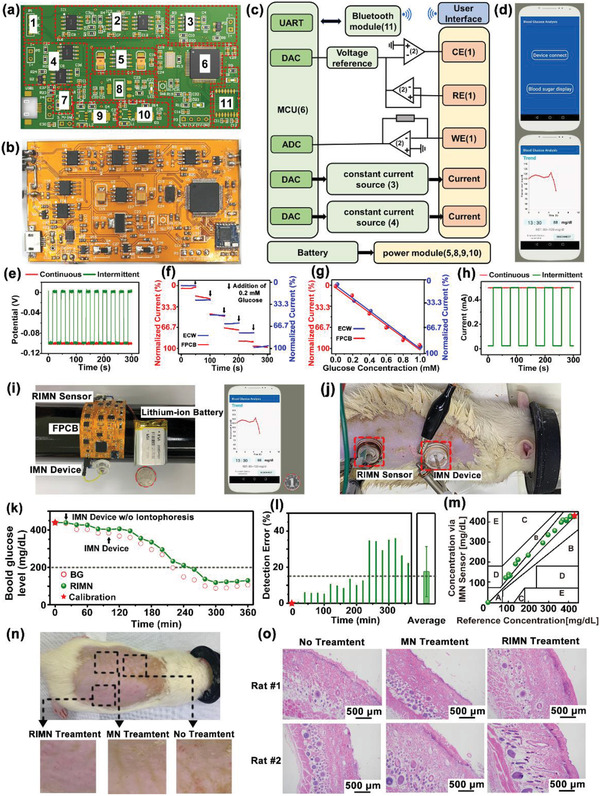
Figure 5.

Performance characterization of the whole IWCS. a) Design sketch and b) the photograph of a flattened FPCB. The red dashed boxes indicate the locations of the integrated circuit components. c) The system block diagram of IWCS. The whole system consists of devices, hardware system, and software system. Hardware system consisted of three‐electrode constant‐potential circuit, signal conditioning circuit, power supply module, Bluetooth, MCU, and two‐channel constant‐current sources. d) The home page (top) and the display page (down) of the smartphone app real‐time showing glucose monitor. e) The voltage output of as‐prepared FPCB at continuous and intermittent constant voltages of 0 and −100 mV, which could be applied as bias potential for sensing. f) The relations of the current signal on glucose electrodes using as‐prepared FPCB and commercial ECW. g) The linear relations of the currents and glucose concentration measured using as‐prepared FPCB compared to ECW. h) The current output of as‐prepared FPCB at continuous and intermittent constant current output at 0.5 mA for iontophoresis. i) The photograph of the whole IWCS (left), including RIMN sensor, FPCB, IMN device, and lithium‐ion polymer battery, communications with a smartphone app (right). A coin (marked with red circle) was placed next to the IWCS for visual size comparison. j) Photograph showing the simultaneous applications of the RIMN sensor and IMN devices on anesthetized rats. k) The dynamic glucose signals upon simultaneous applications of RIMN sensors and IMN devices on diabetic rat model. The detected current signal via RIMN was converted to glucose concentration, and the actual BG were measured via standard glucose test strips. The asterisk indicated the calibration point. The black arrow indicated the time point of insulin delivery by IMN device. The dash line indicated the boundary of normoglycemia (BG <200 mg dL−1). l) Statistical analysis showing the detection errors of RIMN sensor compared to the actual BG at corresponding time points. The asterisks indicated calibration points. The dash line indicated the clinical criterion of error <15%. m) The Clarke's error grid analysis showing the detection accuracy of RIMN sensor compared to the actual BG. The asterisks indicated calibration points. n) Biosafety Tests of MN Applications. Rat were treated with RIMN (0.5 mA) or MN for 5 min, totally four times with 10 min intervals. The images showing the skin surfaces 24 h after treatments of MN. Both RIMN and MN treatments did not cause obvious skin irritation. o) The skin tissues were sectioned and stained with hematoxylin eosin (H&E).
