
Figure 1.
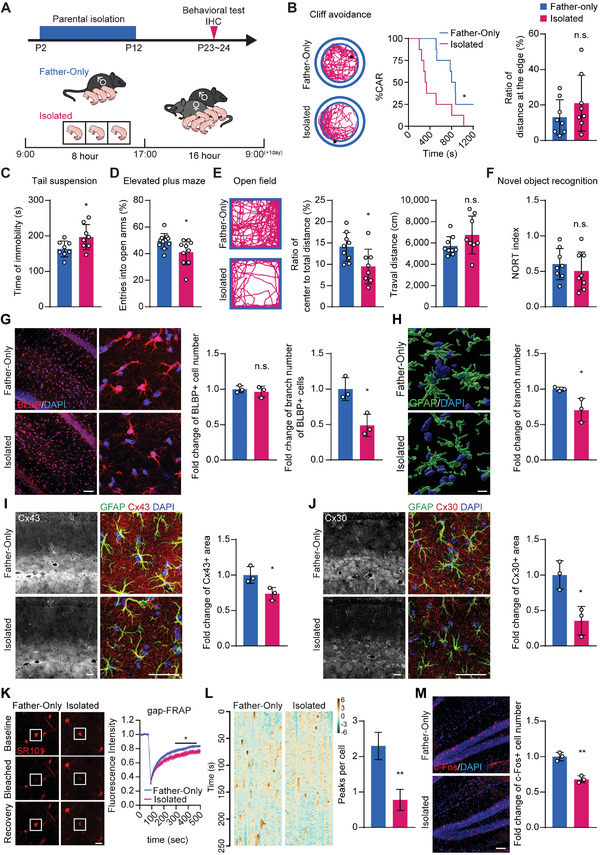
Improved parental isolation‐induced neuropsychiatric behaviors and astrocyte maldevelopment. A) To set up the isolated group (Isolated), mouse pups were separated from their parents and housed individually for 8 h daily (9:00–17:00) from P2 to P12. In the control group (Father‐only), mouse pups were separated from their mothers but stayed with their fathers. Mouse pups were subjected to behavioral tests and IHC analysis on P23. B) Cliff avoidance test: Left: representative diagram of the cliff avoidance test. Black dots represent the mouse position at the experiment endpoint. Middle: reduced cliff avoidance reaction (CAR) was observed in the isolated mice compared to the Father‐only control, suggesting an impulsive behavioral trait. Right: the ratio of travel distance at the edge to total distance was not significantly different between the two groups. The log‐rank (Mantel‐Cox) test was used to compare survival curves. C) Tail suspension test: Isolated mice displayed prolonged immobility times, suggesting depressive behavior. D) Elevated plus maze test: Isolated mice showed reduced entries into the open arm in the elevated plus maze test, suggesting anxiety‐like behavior. E) Open field test: Left: representative diagram of the open field test. The isolated mice exhibited a preference for staying at the edges. Middle and right: the open field test showed that isolated mice traveled less distance and spent less time in the central area, while they showed no statistical differences in mobility, as suggested by travel distance measurements. F) Novel object recognition test: no statistical differences in cognitive function between the Father‐only control and isolated mice. G) BLBP staining showed no difference in astrocyte numbers, but instead displayed reduced astrocyte processes per cell in isolated mice. Scale bar: 100 µm. H) 3D reconstruction of GFAP staining. GFAP+ branch number was reduced in isolated mice. Scale bar: 10 µm. I) Immunostaining of GFAP and astrocytic network proteins Cx43. Reduced Cx43+ area was found in isolated mice. Scale bar: 50 µm. J) Immunostaining of GFAP and astrocytic network proteins Cx30. Reduced Cx30+ area was found in isolated mice. Scale bar: 50 µm. K) gap‐FRAP: Left: representative images of the gap‐FRAP experiment at three different time points. Right: gap‐FRAP experiments showed that the fluorescence recovery rate and amplitude were decreased in the astrocytes of the isolated group, suggesting reduced gap junction channel function. Scale bar: 20 µm. Data presented as mean ± SEM, n = 10. L) Calcium Imaging on acute brain slices stained with Rhod‐4 showed that Isolated mice displayed reduced astrocytic Ca2+ waves. Data presented as mean ± SEM, n = 27. M) The isolated mice demonstrated fewer c‐Fos+ neurons. Scale bar: 50 µm. Data presented as mean ± SD unless stated otherwise. N ≥ 7 mice for behavioral tests, N = 3 mice for immunostaining experiments. p‐values are calculated using unpaired t‐test. *p < 0.05, **p < 0.01, n.s. not significant.