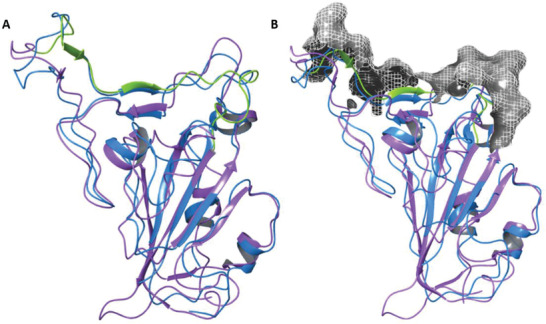
Figure 3.

Comparison of SARS S‐proteins. A) Graphically aligned SARS‐2‐RBD (purple, from protein database, PDB: 6M0J) and SARS‐1‐RBD (blue, from PDB: 2AJF). SARS‐2‐RBM is marked in green. B) Graphically aligned RBDs of both viruses with a surface mesh electrostatic map of S‐protein RBM (grey) in contact with ACE2, produced using Schrodinger Bioluminate software. The close similarity between these two viral RBDs suggests the presence of common neutralizing epitopes.
