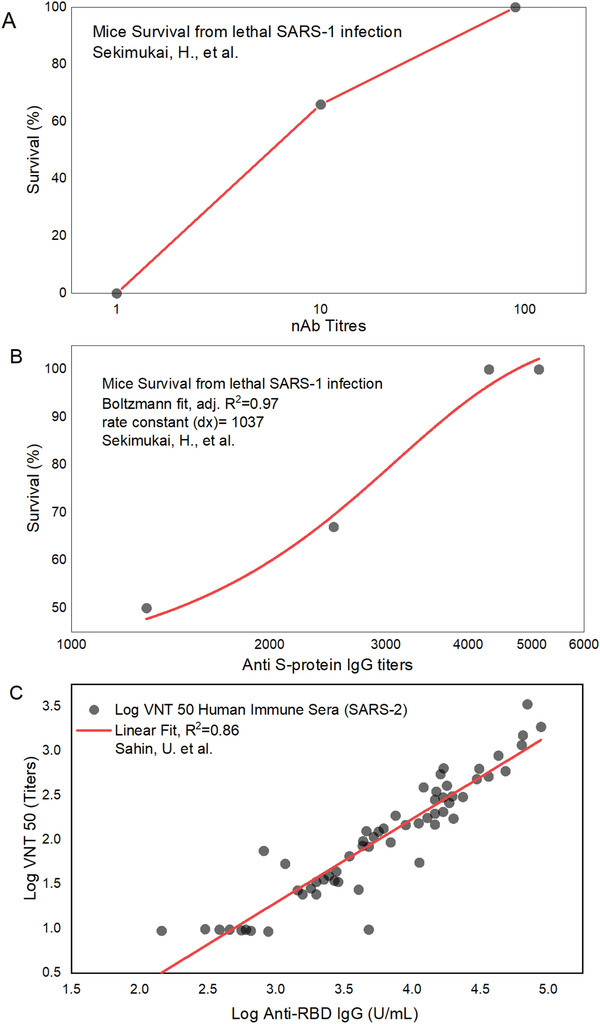
Figure 7.

Dose response curves for A) mean IgG neutralizing Ab (nAb) titers and B) mean total anti‐S‐protein IgG titers expressed as the mean reciprocal serum dilution (n = 6–7 mice per group). Both are plotted against mouse survival, following the administration of SARS‐1‐S‐protein as antigen with TLR‐3‐ligand (poly I:C adjuvant) or without adjuvant.[ 154 ] Log10 of the total anti‐S‐protein titers of 3.5 offers 100% protection in (B), which was equivalent in protective efficacy to neutralizing Ab (nAb) log10 titers of 2 in (A), as both plots are from the same serum samples, (C) relationship between human immune sera against SARS‐2 and neutralization, fitting log IgG concentration and log SARS‐2 neutralization titer 50%, gave LogVNT50 = − 1.53 + 0.94 · Log IgGAnti − RBD, n = 59, R2 = 0.86.[ 149, 150 ]
