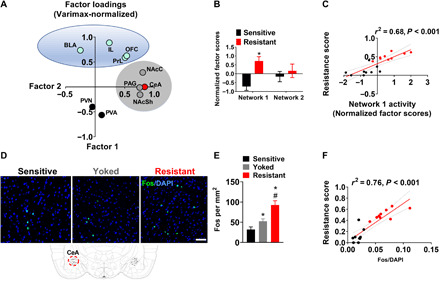
Fig. 2. A brain network associated with punishment resistance.

(A) Factor analysis using principal component extraction followed by varimax normalized rotation of Fos immunoreactivity data identified two networks that showed highly correlated within-network activity. Network 1 consisted of CeA, PAG, NAcC, and NAcSh; network 2 consisted of OFC, PrL, IL, and BLA. (B and C) Activity of network 1, but not network 2, was increased in punishment-resistant rats (*P < 0.001) and correlated with punishment-resistant self-administration. (D) Representative images of Fos immunohistochemistry in CeA in shock-resistant and shock-sensitive rats. Scale bar, 50 μm. (E) Mean number of Fos-immunoreactive neurons/mm2 (±SEM) in shock-resistant (n = 9), shock-sensitive (n = 9), and yoked rats (n = 8). *P < 0.001 versus the punishment-sensitive group; #P < 0.001 versus the yoked group. (F) Activity of CeA was particularly highly correlated with the resistance score. CeA, central nucleus of amygdala; PAG, periaqueductal gray; NAcC, nucleus accumbens core; NAcSh, NAc shell; OFC, orbitofrontal cortex; PrL, prelimbic cortex; IL, infralimbic cortex; BLA, basolateral amygdala.
