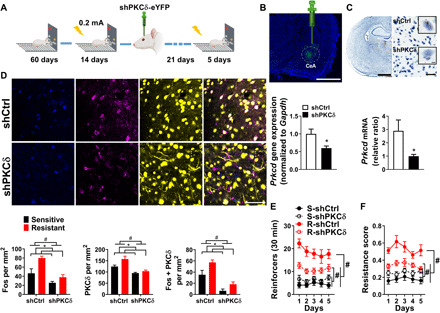
Fig. 5. A mechanistic role of CeA-PKCδ in punishment-resistant alcohol self-administration.

(A) Experimental design. (B) Virus injection site (scale bar, 2 mm) and mean fold change in Prkcd mRNA levels following a viral-mediated knockdown (n = 8 per group). *P < 0.05. (C) Expression of Prkcd in the CeA measured by RNAscope. Brown dots represent the expression of Prkcd [scale bars, 2 mm (left), 50 μm (right), and 5 μm (inset)] (n = 8 per group). *P < 0.05. (D) Representative images of CeA photomicrographs (scale bar, 50 μm) showing Fos (blue), PKCδ (magenta) immunoreactivity, and yellow fluorescent protein (YFP) colabeling. Mean number of cells positive (±SEM) for Fos, PKCδ, and double-labeled cells in punishment-resistant (n = 6 per group) and punishment-sensitive (n = 5 per group) rats/mm2. #P < 0.001, *P < 0.001, *P < 0.05, *P < 0.01. (E) Mean number of alcohol-reinforced lever presses (±SEM) during the 30-min punishment session control in punishment-resistant (n = 19) and punishment-sensitive rats (n = 19) receiving shCtrl, or shRNA knockdown of PKCδ (n = 18; n = 19). #P < 0.001. (F) Mean resistance score (±SEM). #P < 0.001.
